
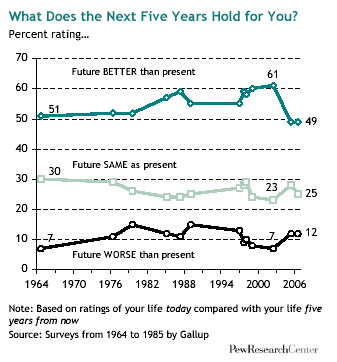
In the past four years, some of the edge has come off good old American optimism.
Just under half (49%) of the respondents in a new Pew Research Center survey rate the quality of the life they expect to be leading five years from now higher than their current quality of life. As recently as 2002, more than six-in-ten (61%) Americans said their future would be better than their present.
The new Pew survey also finds that a quarter of adults rate their life five years from now the same as they rate their current life, while just 12% rate the future worse (the remaining 14% say they aren’t sure). Thus, looking at only the “worse” and “better” ratings, Americans continue to tilt heavily positive — by a ratio of four-to-one — in their outlook about the future.
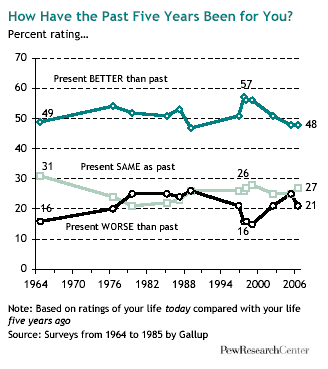
Even so, the downturn in personal optimism since 2002 is the sharpest recorded in the more than 40 years that both Pew and the Gallup organization have been conducting this “ladder of life” survey.1
In the 2006 Pew survey, as in all previous surveys in this series, Americans rate the present above the past and the future above the present. However, taking into account all three sets of ratings (past, present, future), Americans are on average about one-third less upbeat about the trajectory of their lives now than they were in 1999, at the height of a prolonged economic boom.
The Pew telephone survey was conducted from June 20 through July 16, 2006 among a nationally representative sample of 2,003 adults. It has a margin of error of plus or minus 2.5 percentage points.
The ladder of life series employs what researchers call a “self-anchoring scale.” Respondents are first asked to give a numerical rating to their present quality of life. Then, having anchored themselves in the present, they are asked to rate the past and future the same way. They are not asked if they think the future (or past) is better or worse. They are simply asked, in succession, to rate three points in time on the same numerical scale.
According to the 2006 survey, Americans on average give a 6.8 rating (on a zero to ten scale) to their current lives; a 6.1 rating to their lives five years ago and a 7.8 rating to the lives they expect to be leading in another five years. That adds up to an aggregate average of 1.7 rating points worth of forward progress between five years ago and five years hence.
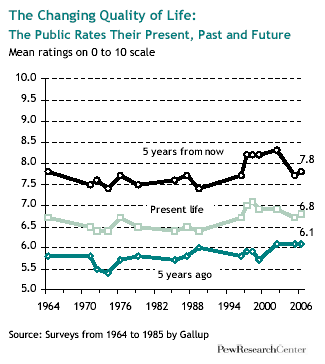
This 1.7 figure in 2006 is a bit below the historical average of 2.0 for all surveys taken since 1964. However, it is fully a third below the 1999 figure of 2.5 — the highest measure of forward progress recorded by this battery of questions.
In the seven years since 1999, the economic boom has long since passed and levels of satisfaction with the state of the nation have fallen off sharply. They are in the low 30 percent range now, down from the mid to high 50 percentage range in the late 1990s. So at a time when people have come to feel worse about the state of the nation, they are also feeling less optimistic about their own prospects for personal progress.
This correlation may seem self-evident, but it needs to be kept in perspective. Survey researchers through the years have noted that there is very little correlation between satisfaction with one’s own current quality of life and satisfaction with the current state of the nation2. The former is a stable trend that changes little over time; the latter moves up and down a lot in response to changes in the economy or other major national events. However, it is not uncommon to find a correlation between feelings about the current state of the nation and feelings about one’s future quality of life, as the latest Pew findings show.
The Trajectory of Life – Who’s Moving Ahead?
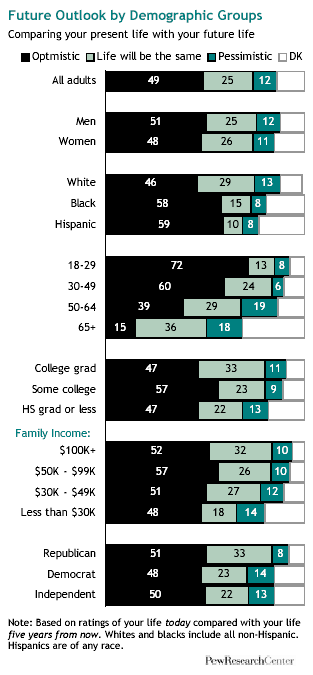
Needless to say, not all Americans are of the same mind as they assess whether they’ve made progress in life and whether they expect to make more in the future.
The groups most likely to forecast future personal progress include younger adults, blacks and Hispanics. The findings show that as people grow older, and especially as they move into their elderly years, their expectations for an improving quality of life decline sharply. Also, blacks and Hispanics are more likely than whites to forecast personal progress for themselves. (On the other hand, whites as a group place themselves considerably higher on the present ladder of life than either blacks or Hispanics place themselves.)
The groups most likely to say they have made progress over the past five years include younger adults, college graduates and people with higher incomes.
Most of these demographic differences have been present in the findings from this battery of questions over the years; however, the correlation between income levels and assessments of past progress have grown stronger over the course of the past four years.
In 2002, 45% of those in the lowest income bracket saw themselves as having made progress, compared with 57% of those in the highest bracket – a 12 percentage point gap. This year, 39% of those in the lowest bracket see themselves as having made progress, compared with 59% of those in the highest bracket – a 20 percentage point gap. This gap, while significantly larger than it was four years earlier, is not unprecedented.
Where People Stand Now
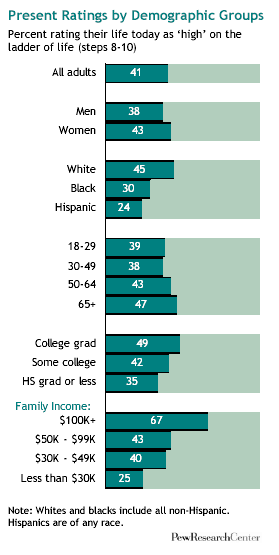
About four-in-ten (41%) Americans rate their life today on one of the top three steps of the ladder of life (from 8 to 10), three-in-ten put themselves just below that as a six or seven and 26% rate their life at the lower levels (from 0 to 5). These figures are about the same as they have been since 2002, though fewer put their life on the highest steps of the ladder today than did so in the late 1990’s.
Income is strongly correlated with how people rate their present life. Two-thirds of those with incomes of $100,000 or more place themselves on the three highest steps of the ladder (8 to 10). A quarter of those with incomes under $30,000 do the same. A multiple regression analysis found that income was the strongest socio demographic predictor of present life evaluations.3
Other groups that are more likely to see themselves on the top three steps of the ladder include whites, more so than blacks or Hispanics; college graduates more so than those with less education; women more so than men; Republicans more so than either Democrats or independents; frequent church attendees more so than those who go to religious services less often; and married people more so than singles. These patterns have been present in this battery of questions over the years.
People who live in areas with low unemployment say their quality of life is higher than do people who live in areas of high unemployment. And, not surprisingly, workers who say they are satisfied with their jobs are more likely to rate their overall quality of life higher.
There are also correlations between one’s level of work satisfaction and one’s assessment of personal progress – although, depending on the time frame, these correlations operate in opposite directions. People who are satisfied with their job are more likely than others to say they have made progress over the past five years. However, looking forward, the opposite is true: people who are dissatisfied with their job are more likely than others to say they expect to make progress in the next five years.
International Comparisons
In 2002 the Pew Global Attitudes Survey administered this same “ladder of life” battery of questions in 44 countries; it found that Americans placed in the middle to upper middle ranges compared with publics of other countries.
Looking backward, Americans were more inclined to say they had made progress than were the publics of any country surveyed in Europe or the Middle East and most of the countries surveyed in Asia, Latin America and Africa. Looking forward, Americans were more optimistic than almost all of the publics of Europe, the Middle East and Latin America, but were less optimistic than most of the publics of Africa and Asia.
How Come the Future Never Lives Up to Its Advance Billing?
Year after year, these ladder of life survey findings all share the same anomaly: the future, once it finally arrives, never measures up to today’s expectation of it. To give just one example, in 1997 the public, on average, expected to enjoy an 8.2 quality of life in 2002. But by the time 2002 rolled around, the public, on average, rated the present as just a 6.9. (See chart.)
This apparent paradox in human perception applies to self-assessments of the past as well (the public rates the past worse in retrospect than they rated it at the time). As a result, at any given moment, the public as a whole believe they were worse off in the past and will be better off in the future. That suggests a blissful state of constant human progress. But there’s just one problem: over the course of time, the public’s evaluations of the present rarely changes. So what gives?
Some psychologists have theorized that human beings are hard-wired to imagine brighter tomorrows because the act of doing so is pleasurable in and of itself.4 Thinkers from other disciplines have other theories. For example, economist Richard Easterlin of the University of Southern California has suggested that this paradox can be explained by the interaction between human nature and rising personal income.5
Over the course off their adult lives, Easterlin notes, most people acquire more money and material goods. That’s a big part of the reason they expect tomorrow to be better than today (and rate today better than yesterday). However, as people get more, they also want more — and so they never achieve the increased level of satisfaction that they thought they would.
This is a neither a new insight nor a new dilemma. Back in 1776, long before survey researchers started asking their questions, writer Samuel Johnson observed: “Life is a progress from want to want, not from enjoyment to enjoyment.”
About the Survey
Results for this survey are based on telephone interviews conducted with a nationally representative sample of adults, ages 18 years and older, living in continental U.S. telephone households. The sample design included a representative sample of 1,182 respondents and an oversample of 821 respondents ages 18 to 64. The data are weighted to produce a final sample that is representative of the general population of adults in the continental United States.
- Interviews conducted June 20-July 16, 2006
- 2,003 interviews
- Margin of sampling error is plus or minus 2.5 percentage points for results based on the total sample at the 95% confidence level. The margin of sampling error is higher for results based on subgroups of respondents.
Survey interviews conducted under the direction of Princeton Survey Research Associates International. Interviews were conducted in English and Spanish.
Bear in mind that question wording and practical difficulties in conducting surveys can introduce error or bias in the findings of opinion polls.
Read the full report for more details.


