I. Overview
Chin up, Republicans. Despite the imploding stock market, the looming recession, the unpopular president and the dismal political polls, there’s very good news in the one realm of life that’s always been a special sanctuary for you.
Personal happiness.
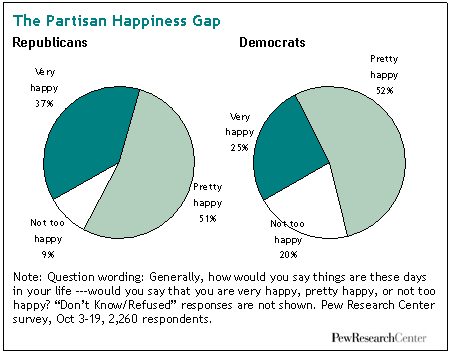
Some 37% of you say you’re “very happy” with your lives, compared with just 25% of Democrats who feel the same way, according to a new nationwide Pew Research Center survey conducted from Oct. 3 through Oct. 19– a period that’s witnessed a race to the bottom between John McCain’s poll numbers and the public’s 401(k) account balances.
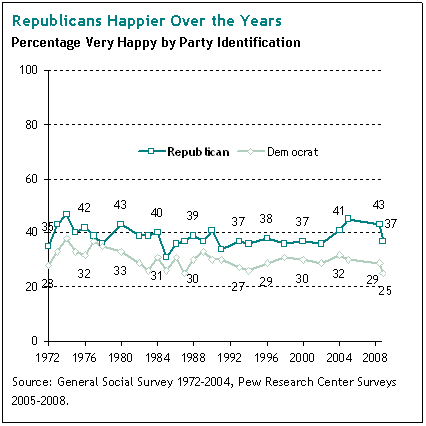
This big GOP edge in life’s happiness sweepstakes is not a new phenomenon. Ever since the General Social Survey1 first asked the question in 1972, Republicans have always been happier than Democrats. But the current gap is among the largest on record.
What accounts for it? And how has it been able to withstand this fall’s avalanche of unhappy political news for the GOP?
Well, Republicans are different from Democrats. How so? Let us count the ways.
-
They have more money.2
- They have more friends.3
- They are more religious.4
- They are healthier.5
- They are more likely to be married.6
- They like their communities better.7
- They like their jobs more.8
- They are more satisfied with their family life.9
- They like the weather better.10
- They have fewer financial worries.11
- They’re more likely to see themselves doing better in life than their parents did.12
- They’re more likely to feel that individuals– rather than outside forces– control their own success or failure.13
- They have more of what they most value in life. (No, it’s not money).14
All of these differences are associated with the partisan happiness gap. But a word of caution: It can get very tricky trying to disentangle causes from effects. Even though happiness research has become a cottage industry in recent years, no one has yet been able to nail down all the factors that explain the persistent– and growing– Republican happiness advantage. No definitive answers will be available here, either. However, a close examination of data from three Pew Research Centers surveys taken in 2008 may shed new light on this intriguing gap.
Let’s start with some key demographic indicators. As is well known, Republicans, on average, have more money than Democrats. And– all those lectures from parents, teachers and pastors to the contrary notwithstanding — it turns out that money and happiness tend to go hand in hand, not just in this country but all over the world.15
In the latest Pew survey, some 35% of those with family incomes above $100,000 a year report being very happy, compared with just 27% of those with annual incomes of less than $50,000. (A June Pew survey had found an even wider happiness gap by income– 46% of the $100,000-plus income group reported being very happy in that survey, compared with 30% of the under $50,000 group– perhaps suggesting that the recent stock market miseries have disproportionately intruded on the happiness of those in higher income brackets). Pew surveys also find that Republicans have more money than Democrats– on average, about $18,000 more a year in annual family income, according to a February survey. And when it comes to household wealth, the Republican advantage over Democrats is even greater.
Next up on the demographic check list is marriage. Republicans are more likely than Democrats to be married, and married adults are more likely than unmarried adults to report that they are very happy– 34% vs. 24%.
But let’s stop right here, because these correlations raise as many questions as they answer. Is it that happy people get married, or that married people get happy? Does money lead to happiness, or happiness to money? Or might some unrelated factor be creating correlations which don’t actually have any causal connection?
This is where something called regression analysis can be helpful. It is a statistical technique that measures the independent importance of each of a number of variables in predicting a phenomenon of interest– in this case, the likelihood that someone is very happy.
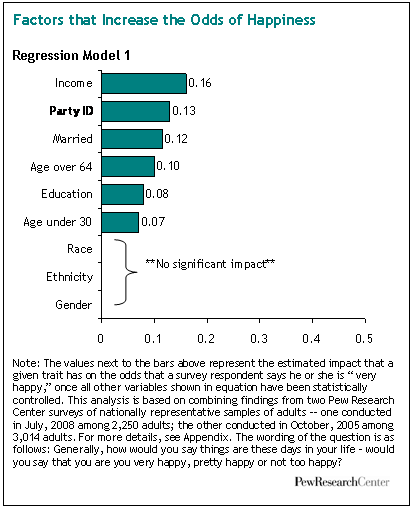
For the purposes of this analysis, we constructed two regression models from the Pew survey data. The first looks at respondents’ party identification along with their basic demographic traits (age, gender, race, ethnicity, income, education, marital status). It then computes the odds that any single one of these traits will have a bearing on a person’s likelihood of being very happy, once all of the other variables in the model have been held constant. (For a more thorough explanation, see Appendix).
In Model One, income has the greatest impact on predicting happiness: a high income person has a 16% greater chance than a low income person at being very happy, once all the other characteristics in the model have been held constant. Next on the list in this model is being a Republican rather than a Democrat– this increases someone’s odds of being very happy by 13%, once all the demographic variables in this equation have been controlled. In other words, if one were to compare a theoretical Republican and a theoretical Democrat who had the identical age, ethnicity, race, gender, income, marital status and education level, the Republican would be 13% more likely than the Democrat to be very happy.
To be clear, this does not prove that being a Republican “causes” happiness. But it does demonstrate that, even after setting aside all the demographic traits that separate partisans of the two parties, a Republican is still a bit more likely than a Democrat to be very happy.
Our second regression model (Model Two) throws two additional variables into the equation– church attendance and health status. Neither of these variables is a demographic trait per se, but both have been shown, in surveys taken over the years, to be correlated with happiness. And indeed, as Model Two demonstrates, they are more powerful than any demographic trait in predicting happiness. Someone who reports being in excellent/very good health has 34% better odds of being very happy than does someone who reports being in poor health, once all other variables in the equation are held constant. Likewise, someone who attends religious services weekly or more often has an 18% better chance of being very happy than someone who attends services seldom or never.
Adding these two factors to the regression model has the effect of reducing, but not eliminating, the independent impact of partisan identification on happiness– from 13% in the first model to 7% in the second model.
Seven percent may not sound like much, but it means that someone’s party identification has a greater direct bearing on that person’s odds of being very happy than does the person’s race, ethnicity or gender. In both models, none of those factors has any independent impact on someone’s chances for happiness, once the regression analysis has done its little magic. (To be sure, those traits may well have an indirect impact on happiness, because they correlate with variables that predict happiness, such as income, marriage and church attendance).
Where does this small but persistent GOP happiness edge come from? A February 2008 Pew Research Center survey looked at differences between Republicans and Democrats in their life priorities, values and experiences, and explored how these differences relate to overall levels of life satisfaction. The story that emerges from the survey data is quite consistent: advantage Republican.
Life Satisfaction
Life satisfaction is not the same thing as happiness. The former is an evaluation of one’s circumstances; the latter is a measure of one’s feelings. Nevertheless, and not surprisingly, the two measures are highly correlated. And, as with happiness, Republicans have a clear advantage on the life satisfaction front.
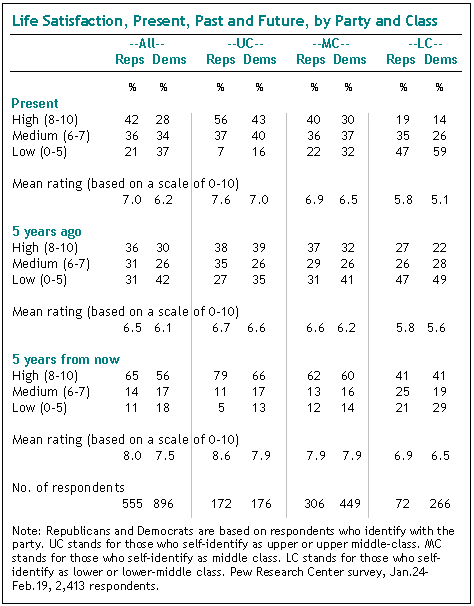
Some 42% of Republican respondents in the February Pew survey rate their present quality of life on the top three rungs of a ten-step scale; an additional 36% place themselves on the next two rungs, and just 21% place themselves on rung five or below. Among Democrats, by contrast, just 28% rate their life on the top three rungs, while 34% place themselves on the next two rungs and 37% say they are on rung five or lower.
Republicans also give higher rankings than Democrats to the life they were leading five years ago, and to the life they expect to be leading five years from now. This same “ladder of life” battery of questions has been asked in Pew surveys many times over the past decade, and Republicans have always outscored Democrats (though margins vary from year to year).
No doubt, much of the GOP advantage in life satisfaction is tied to their income and wealth advantage over Democrats. In an effort to control for those economic factors, the survey asked respondents to place themselves into one of five socio-economic classes– upper, upper-middle, middle, lower-middle and lower. Even after taking into account this sorting by class, the survey finds that the GOP advantage holds up– that is, upper-class Republicans are more satisfied than upper-class Democrats; middle-class Republicans are more satisfied than middle-class Democrats; and lower-class Republican are more satisfied than lower-class Democrats.
Personal Progress
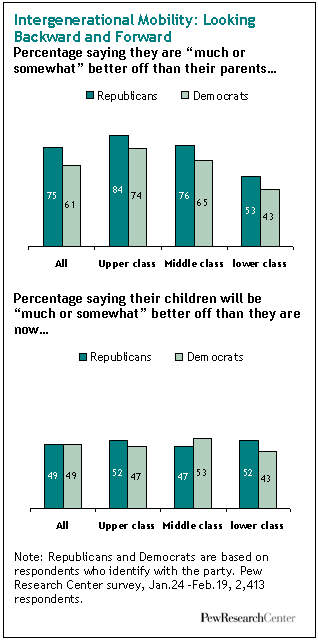
One pillar of the American dream is the idea that each generation does better than the one that came before. On this measure, Republicans score better than Democrats– some 75% say their standard of living is better than the one their parents had at the age they are now; compared with just 61% of Democrats who say the same thing.
On this question, too, Republicans in each socio-economic class enjoy an edge over their Democratic counterparts in the same socio-economic class. For example, 76% of self-identified middle-class Republicans say they are doing better than their parents, compared with 65% of self-identified middle-class Democrats who say the same thing. The partisan gaps are nearly identical among the lower and upper classes.
There’s virtually no partisan gap on the question of whether people believe their own children will have a better standard of living than they themselves have now. Overall, exactly 49% of both Republicans and Democrats say they expect their children to do better in life than they themselves have done. Among the self-identified middle class, Democrats (53%) are slightly more optimistic than Republicans (47%) on this question. However, among the self-identified upper and lower classes, the optimism on this measure tilts slightly in the Republican direction.
Life Priorities; Life Circumstances
The February Pew survey found that Republicans are better than Democrats at aligning their life priorities with their life circumstances. Put another way: Republicans, as a group, tend to want what they already have. Democrats, as a group, tend to want what they don’t have.
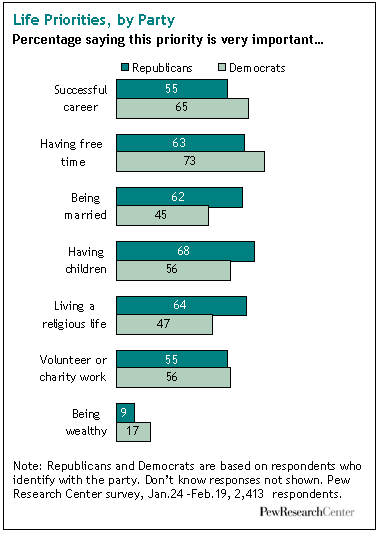
Republicans are more inclined than Democrats to say they place a high value on being married (62% of Republicans say this is a very important priority in their life; 45% of Democrats say the same); on having children (68% of Republicans vs. 56% of Democrats say this is a very important priority) and on living a religious life (64% of Republicans vs. 47% of Democrats say this is a very important priority). And, sure enough, Republicans are more likely than Democrats to be married (62% vs. 44%); and to attend religious services at least once a week (51% vs. 30%). They are also slightly more likely to have children (75% vs. 73%), though this difference is not statistically significant.
Democrats, by contrast, place more emphasis than Republicans do on having a successful career (65% of Democrats vs. 55% of Republicans say this is a very important priority in life); on being wealthy (17% of Democrats vs. 9% of Republicans call this an important priority ); and on having free time to do the things they want to do (73% of Democrats vs. 63% of Republicans).
But Democrats do not do as well as Republicans at matching their desires with their circumstances.
For starters, they are not as well-off financially as Republicans. The February Pew survey found that the median annual family income for Republicans is about $64,000, compared with about $46,000 for Democrats. Also, Republicans are more likely than Democrats to own a home (74% vs. 61%); the median value of their home is higher ($223,830 vs. $199,502); more of them have paid off all the money they owe on their homes (35% vs.27%); and their home is a smaller percentage of their overall family net worth (just 25% of Republicans, compared with 33% of Democrats, say their home accounts for more than half of their overall family net worth).
Career success and free time are more difficult priorities to quantify. But if one measure of career success is income and wealth, clearly Democrats come up short, relative to Republicans. And if another measure is job satisfaction, here, too, they come up a bit short– some 29% of Democrats say they are completely satisfied with their jobs, compared with 33% of Republicans who say this (a small but not statistically significant difference).
Do Individuals Control Their Own Destiny?
Who or what determines success in life– the individual or outside forces? And how do views on that question line up with life satisfaction?
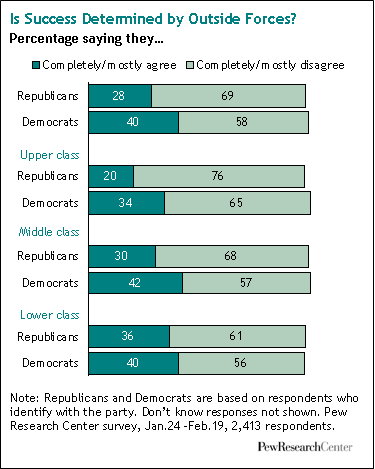
There’s a big partisan gap on the first question. Republicans are less inclined than Democrat to say that success in life is mostly determined by outside forces. Just 28% of Republicans– compared with 40% of Democrats– hold this view. The partisan difference on this question is biggest among those who identify with the upper classes — some 34% of Democrats but just 20% of Republicans who call themselves upper or upper middle class say that success in life is mostly due to outsideforces. Among the self-defined middle class, Democrats (42%) are also more inclined than Republicans (30%) to hold this view.
People who say that success is mostly determined by outside forces are less satisfied with their life (average life satisfaction rating: 6.1 on the zero to ten scale) than are those who disagree with that proposition (average rating of 6.6 on the life satisfaction scale).
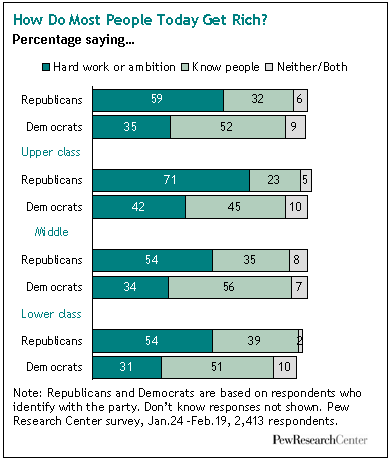
On a related question– how do the rich become rich– there is a similar partisan gap. Some 59% of Republicans say the rich become rich mainly through their hard work and ambition; just 35% of Democrats agree. The majority of Democrats (52%) say the rich get rich mainly through good connections or being born into it; just 32% of Republican agree. These partisan gaps persist through all levels of self-identified class.
Financial Worries
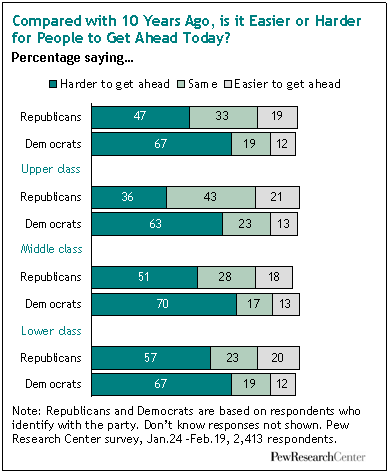
It may be that one of the key factors that explain the Republican happiness edge is no more complicated than this: Republicans have fewer financial woes than Democrats.
The February survey asked about a range of financial problems that people may have had in the past year– related to employment, household expenses, medical bills, and rent or mortgage payments. On every measure, Republicans reported having had fewer problems than did Democrats. And, once again, the Republican advantage held even when the comparisons were between partisans who self-identify in the same socio-economic class.
The survey also asked respondents whether they anticipate having these kinds of financial problems in the year ahead. Here again, Republicans are significantly less inclined than Democrats to express anxieties about money.
A more recent Pew Research Center survey, taken in mid-October during the height of the current stock market turmoil, found that while about nine in ten Americans rate the national economy as only fair or poor, nearly six in ten Republicans (57%) rate their personal finances as excellent or good. In contrast, just 35% of Democrats give these same positive ratings to their personal finances.
Views about Economic Mobility
Given these differences in economic circumstances and attitudes, it’s no surprise that Democrats have a much more downbeat view than Republicans about economic mobility in general.
In the February Pew survey, some 67% of Democrats, compared with just 47% of Republicans, say it is harder for people to get ahead today than it was ten years ago. The partisan gap on this question persists through all three self-identified classes, though it is greater among those in the upper classes (a gap of 27 percentage points) than among those in the lower economic classes (a gap of 10 percentage points).
Bottom Line
Public opinion survey research, no matter how exhaustive, can never hope to untangle all the mysteries of personal happiness– to do so would require an impossible journey into the human heart. One obvious limitation of the Pew surveys discussed in this report is that they did not explore respondents’ psychological characteristics,which surely have something to say about whether a given individual is happy or not.
Nevertheless, there is a growing body of scholarly research, not just in this country but around the world, which supports the basic finding of these Pew surveys: that Republicans (or conservatives) are happier than Democrats (or liberals), and that these gaps persist even after basic demographic factors have been controlled.
At least in the United States, this partisan happiness gap has widened in recent years. At the moment, in the teeth of a raging economic storm, the Republican happiness edge is roughly as big as it’s ever been. Meantime, Democrats this month have sunk to a modern low on the happiness scale– just 25% say they are “very happy” with their lives.
Chin up, Democrats. You’re clearly not feeling too good these days about your lives or your pocket books. So, why not focus instead on politics? With less than two weeks until election day and the polls going your way, there’s got to be a glimmer of happiness out there for you somewhere. No?

