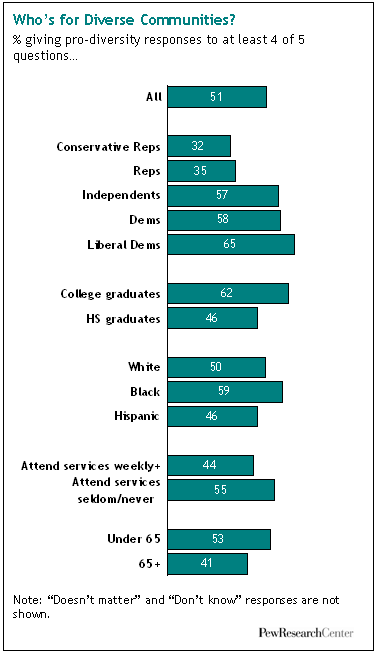
About six-in-ten Americans say they like the idea of living in politically, racially, religiously or economically mixed communities, while about a quarter take the opposite view: they would rather live in communities made up mostly of people like themselves. The rest say they have no strong opinion, according to a new nationwide Pew Research Center Social & Demographic Trends survey.
This preference for diverse communities is greater among Democrats, liberals, college graduates, blacks and secular Americans than it is among the population as a whole. But virtually all major groups, at least to some degree, choose diversity over homogeneity when asked where they would like to live.
Despite these pro-diversity attitudes, however, American communities appear to have grown more politically and economically homogenous in recent decades, according to analyses of election returns and U.S. Census data.
Most notably, nearly half (48%) of all votes for president in 2008 were cast in counties that went either for Barack Obama or for John McCain by a margin of at least 20 percentage points. Back in 1976, only 27% of all voters lived in such “landslide counties,” according to figures compiled by Bill Bishop and Robert Cushing, authors of “The Big Sort,” a book which argues that Americans are clustering into politically like-minded enclaves.1
It’s not clear whether this residential political polarization is a result of explicit decisions by people who move or a byproduct of other demographic trends. But feither way, the pattern runs contrary to the attitudes expressed by a sizable majority of the public in the Pew Research Center telephone survey, which was conducted from Oct. 3 through Oct. 19 among a nationally-representative sample of 2,260 adults. Survey respondents were asked if they would rather live in a community where most people share their own political views or one with a mix of different political views. Similar questions were posed about attitudes toward racial, religious and socioeconomic diversity, and about the public’s receptivity to living among immigrants. The survey’s key findings:
Politics
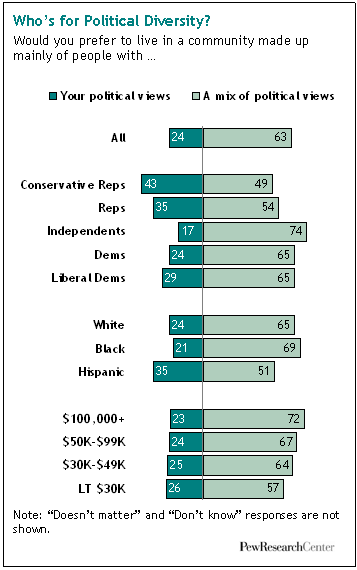
Some 63% of Americans say they would rather live in a community where people have a mix of political views; while 24% say they would prefer to live mainly among people who share their political views. The groups most inclined to say they prefer to live in politically like-minded communities include Republicans generally(35%), conservative Republicans (43%) and Hispanics (35%). The groups most inclined to say they prefer politically diverse communities include blacks (69%), independents (74%) and people earning more than $100,000 a year (72%).
Rural residents are a bit less inclined than those who live in cities, suburbs or small towns to say they favor politically diverse communities.
Likewise, people who live in “landslide counties” are less favorably disposed to politically diverse communities than are other Americans.
For example, while just 35% of all Republicans say they would prefer living in a politically homogeneous community, fully 44% of Republicans who live in a county that voted 60% or more for the GOP presidential candidate in both 2008 and 2004 say they would prefer to live in a politically homogenous community. The pattern is similar on the Democratic side. Among all Democrats, just 24% say they would rather live in a politically homogeneous community. But among Democrats who live in a county that voted for the Democratic presidential candidate by at least 60% in 2004 and 2008, some 31% sfay they prefer living among people who share their political views.
These findings raise some intriguing chicken-and-egg questions. Do people who are less enamored of diversity gravitate to communities where they know they will be among neighbors who share their political views? Or, alternatively, does living in a politically homogeneous community diminish a person’s tolerance for diversity? Or might there be other explanations for these correlations?
The data are inconclusive on these questions. Comparing the attitudes of respondents who have moved into a landslide county in the past decade with those who have lived in such communities most or all their lives, one finds no statistically significant difference between the attitudes of each group toward community diversity.
The survey also shows that, broadly speaking, public attitudes about political diversity in a community line up closely with attitudes about racial, religious and socioeconomic diversity. A rundown of these other findings:
Race
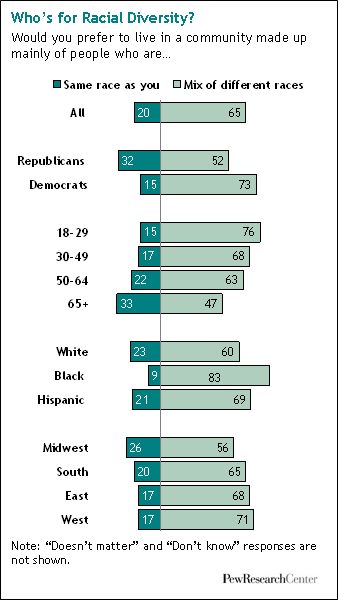
Some 65% of Americans say they would rather live in a community composed of a mix of racial and ethnic groups, while 20% say they would rather live in a community made up mainly of people who are the same race as they are. Democrats say they prefer racial diversity over homogeneity by 73%-15%; Republicans say they prefer racial diversity over homogeneity by a smaller margin — 52%-32%.
Blacks say they prefer racially and ethnically mixed communities to mainly black communities by a lopsided 83%-to-9% margin. Whites say they prefer racially and ethnically mixed communities over mainly white communities by a smaller, but still sizable margin of 60% to 23%. Hispanics fall in between– 69% prefer racial and ethnic diversity in their communities, while 21% would rather live in a place where most people are the same race and ethnicity as them.
There are also significant differences on this question by age, with the preference for homogeneity greater among older adults than young ones. And geographically, the Midwest stands out as the region where there is the least support for racially diverse community — though even among Midwesterners, diversity is preferred over homogeneity by a margin of more than two-to-one.
Religion
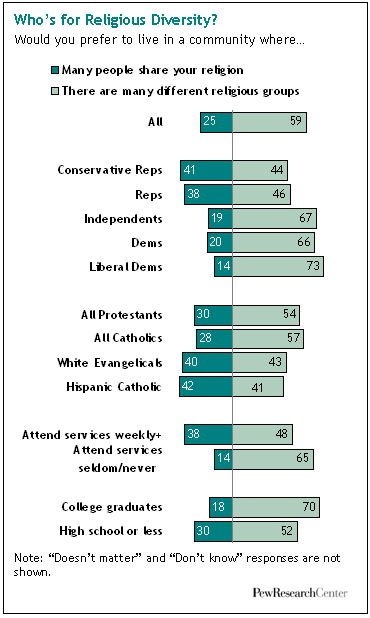
Some 59% of Americans say they would rather live in a community where there are many people with different religions, while 25% say they would prefer to live mainly among people who are the same religion as they are. Some 40% of white evangelicals, 42% of Hispanic Catholics, 38% of those who attend religious services at least weekly and 41% of conservative Republicans say they would rather live in communities mainly filled with people who share their religion.
By contrast, just 14% of liberal Democrats, 20% of all Democrats, 14% of those who seldom or never attend religious services, 18% of college graduates and 21% of white non-Hispanic Catholics say they would prefer to live mainly among people who are the same religion as they are.
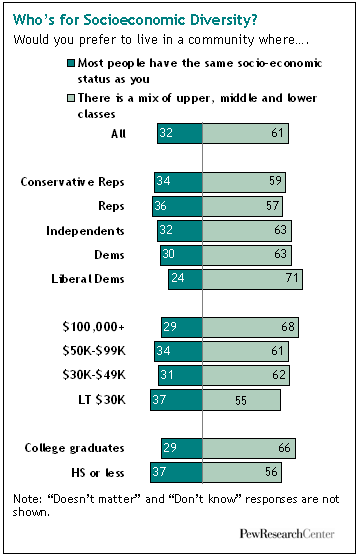
Socioeconomic status
Some 61% of Americans say they would rather live in a community which is home to a mix of people in the upper, middle and lower classes, while 32% say they would rather live in a place where most people are the same social and economic class as they are. Liberal Democrats prefer diversity on this front by a margin of 71 %-24%; conservative Republicans by a narrower margin of 59%-34%.
The preference for living in an economically diverse community rises with rising socioeconomic status. Some 66% of college graduates say they woufld rather live in socially and economically mixed communities; compared with just 56% of those who have high a school degree or less. Similarly, 68% of those who earn $100,000 a year or more opt for diversity, compared with just 55% of those who earn less than $30,000 a year.
Immigrants
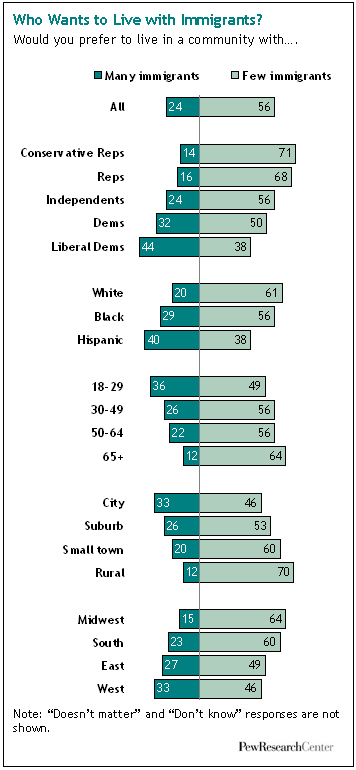
This question was not worded the same as the others: Respondents were asked if they preferred living in a community with a large or small immigrant population. Perhaps because of the wording difference (necessitated by the fact that just one-in-eight Americans are immigrants), this is the only question in the battery to which a minority of respondents gave the pro-diversity answer. By 56%-24%, Americans say they prefer living in a community with a small rather than large immigrant population.
Groups in which the smallest shares of people say they would want to live among a lot of immigrants include those over age 65 (12%), those who live in rural areas (12%), and conservative Republicans (14%). Groups most receptive to living in communities with a lot of immigrants include liberal Democrats (44%), Hispanics (40%), city dwellers (33%), Westerners (33%) and college graduates (32%).
Group Differences
Looking at the responses by various groups to this full battery of questions, one finds that the largest gaps in attitudes are by partisanship and ideology. Some 58% of Democrats, compared with just 35% of Republicans, give the diversity-oriented response to at least four of the five questions. Combining ideology with partisanship produces an even larger gap; 65% of liberal Democrats, but just 32% of conservative Republicans, give the pro-diversity responses to four of the five questions. Self-described independents are much closer to Democrats than to Republicans in their views; 57% of independents give the pro-diversity response to at least four of the five questions.
Educational attainment is another characteristic that divides respondents to these questions. Some 62% of college graduates, compared with just 46% of those with no more than a high school degree, give the pro-diversity response to at least four of the five questions.
There are smaller group differences by age, race and church attendance. Some 59% of blacks, compared with 50% of whites and 46% of Hispanics give the pro-diversity response to at least four of the five questions. Some 55% of those who seldom or never attend religious services, compared with 44% of those who attend weekly or more, give the pro-diversity responses to at least four of the five questions. And 53% of those ages 18 to 64, compared with 41% of those ages 65 and older, give the pro-diversity response to at least four of the five questions.
The Facts on the Ground
All of these survey findings raise an obvious question: Is the public’s generally strong preference for diverse communities to be taken at face value, or might it be based in part on respondents choosing the answers they deem to be socially desirable?
While it’s impossible to know for sure, it is worth noting that residential segregation has long been a fact of life in America, and that, at least by certain measures, some varieties of segregation appear to be on the rise.
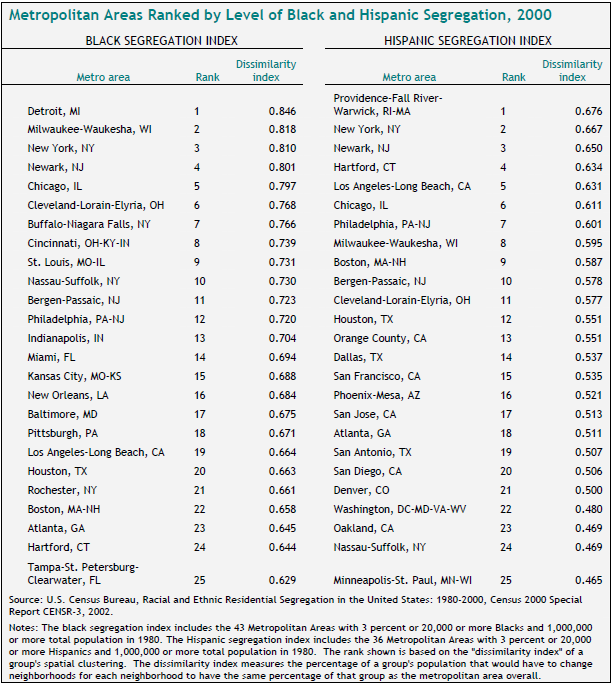
The most pervasive forms of residential segregation, by far, are racial and ethnic. According to the U.S. Census Bureau, while blacks comprise just 12% of the U.S. population, about half of all blacks in 2000 lived in majority-black neighborhoods2. Hispanics also tend to be clustered into segregated enclaves, though not quite to the same degree as are blacks. Latinos made up 12.5% of the U.S. population and 43% lived in majority-Latino neighborhoods as of 2000. (The table below ranks the nation’s most populous multi-racial and multi-ethnic metropolitan areas by their levels of black/non-black and Hispanic/non-Hispanic residential segregation.)
Trends in residential segregation have been mixed over the past several decades. Black/white segregation has declined significantly since 1960, when fully 70% of blacks lived in majority black neighborhoods3. But immigrant segregation as well as Hispanic and Asian segregation has increased in recent decades4, as has overall economic segregation. From 1970 to 2000, there was a 32% increase in the residential separation of high income Americans (those in the top income quintile) from all other Americans, according to one analysis of Census data5. Even with this increasing spatial isolation of the well-to-do, however, blacks are still nearly three times as segregated from whites as are affluent Americans from those who are less well off.
What about trends in political segregation? The very durability of the buzzwords “Red America” and “Blue America” is a testament to a fairly entrenched political map in which most of the nation’s 50 states have voted reliably for one party or the other (at least in presidential contests) for many decades. And, as Bishop and Cushing have demonstrated, this political polarization by geography increasingly now extends down to the county level as well.
However, a note of caution is in order: counties and communities are not one and the same. Large counties can contain scores of communities, many with differing demographic and political profiles. Thus, the increasingly polarized voting patterns at the county level, while consistent with a trend toward self-selection into politically like-minded communities, is not proof that such a trend exists.
Moreover, not even Bishop says he believes that people choose where to live in order to be among neighbors who vote as they do. Rather, he theorizes that they choose to live among people who share their backgrounds, tastes and lifestyles– and that these likenesses, increasingly, correlate with like-minded political views6.
There’s some evidence in support of this “big sort” theory from recent election returns and Census data– but very little from the new Pew Research survey. It may just be that, when the subject is community diversity, Americans talk one way but behave another.
About the Survey
Results for this survey are based on telephone interviews conducted with a nationally representative sample of 2,260 adults living in the continental United States. A combination of landline and cellular random digit dial (RDD) samples was used to represent all adults in the continental United States who have access to either a landline or cellular telephone. A total of 1,502 interviews were completed with respondents contacted by landline telephone and 758 from those contacted on their cellular phone. The data are weighted to produce a final sample that is representative of the general population of adults in the continental United States.
- Interviews conducted from October 3-19, 2008
- 2,260 interviews
- Margin of sampling error is plus or minus 2.3 percentage points for results based on the total sample at the 95% confidence level.
- Note on terminology: Whites include only non-Hispanic whites. Blacks include only non-Hispanic blacks. Hispanics are of any race.
Survey interviews conducted under the direction of Princeton Survey Research Associates International. Interviews conducted in English or Spanish.
Acknowledgments Several Pew Research Center colleagues contributed to the research, data analysis and writing of this report, including Wendy Wang, research analyst; Richard Fry, senior researcher; D’Vera Cohn, senior writer; and Daniel Dockterman, research assistant. The authors also wish to thank our colleagues Andrew Kohut and Scott Keeter for their methodological and editorial suggestions; and Bill Bishop and Tim Murphy for providing us with county-by-county voting data from the 2004 and 2008 presidential elections.


