Retirement? Not so fast! The nation’s older adults are less inclined now than at any time since the 1960s to give up on the working life.2 Meantime, the nation’s young adults have grown more likely to hit the books than to fill out a time card. The result is a labor force that’s been getting grayer and is poised to continue on that path into the foreseeable future.
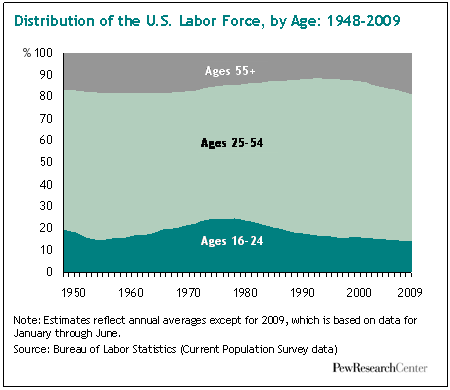
People ages 55 and older currently account for 18.7% of the U.S. labor force, according to data from the Bureau of Labor Statistics (BLS).3 That is the highest share held by this age group since the BLS started reporting labor force statistics in 1948. Conversely, younger workers, ages 16 to 24, currently account for only 14.0% of the labor force, their lowest share since 1948.
Moreover, projections by the BLS indicate that virtually all (92.8%) of the growth in the U.S. labor force from 2006 to 2016 will be workers ages 55 and older.4
The share of the labor force that is 55 and older will increase to 22.7% in 2016. At the same time, the shares of other major age groups will decline.
The rising age of the American work force is the result of two trends. The first is strictly demographic — in particular, the passage of the outsized baby boom generation (adults now ages 45 to 63) into older age. The second is changes in work-related behaviors — a rising share of older adults are working or looking for work and, conversely, an increasing share of youth are staying in school and not looking for work. Those personal choices are having a significant impact. The BLS projections show that one-third (32.7%) of the total growth in the labor force from 2006 to 2016 will derive from more older workers deciding to remain in the labor force.5
The nation is also witnessing what may be the end of an important era-the rapid growth in the presence of women in the U.S. labor market. In 1948, women accounted for only 28.6% of the U.S. labor force. By 2000, their share had increased to 46.5%. It has not increased much in this decade and currently stands at 46.8%.
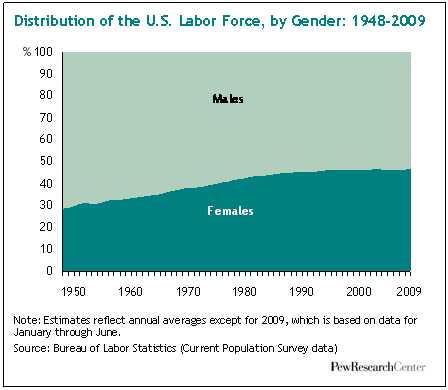
The most rapid flow of women into the labor force took place after 1970, pausing not even for the deep recessions in the 1970s and 1980s. In 1970, only 43.3% of women were active in the labor force, in other words, either employed or looking for employment. Women streamed into the labor force in large numbers for the next 30 years. By 1999, labor force participation among women had risen to 60.0%.
In this decade, however, the secular growth in labor force participation among women appears to have come to a halt. Labor market activity among women dipped during the 2001 recession, and the slow recovery that followed did little to reverse the trend. The current recession appears to have kept the lid on any recovery in the labor force participation rate for women.6 Thus, the share of women in the labor force has moved little, either up or down, since 2000.
This chapter analyzes Census Bureau and BLS data to describe recent trends in labor force participation.7 Covering the period from 1995 through June 2009, it explores the latest developments among older workers, younger workers, and women. The focus is on labor force participants-those employed and those who are unemployed and looking for work. Workers who are unemployed and not currently looking for work, often described as marginally attached workers, are not counted as labor force participants..
In hard economic times, it is not uncommon for labor force participation to weaken as sluggish demand and long-term unemployment cause more workers to quit looking for work. In the 1990s expansion, the labor force participation rate in the U.S. rose from 66.5% in 1995 to 67.1% in 2000, an historic high. It fell during the 2001 recession and has fallen again in the current recession, averaging 65.5% in the first half of 2009.
However, labor force activity among older adults has shown no such inclination. Both during the 2001 recession and the current recession, the labor force participation rate of workers ages 65 and older has risen in a secular fashion. Conversely, labor force participation among younger workers decreased steadily since 2000. The labor force participation rate for women has responded, as one might expect, to fluctuations in business conditions in this decade.
Age
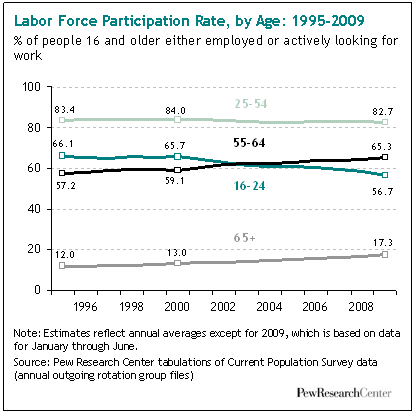
Work harder, work longer — that appears to be the new motto for older Americans. Those who turned 55 in the current decade display a much greater inclination than their predecessors to remain active in the labor market. At the same time, younger Americans — ages 16 to 24 — have maintained a clear, downward trajectory in labor market activity.
A discernible rise in labor force activity among older workers appears at the turn of the century. For people ages 55 to 64, the labor force participation rate increased modestly from 57.2% in 1995 to 59.1% in 2000. It subsequently rose at a much faster pace, to 65.3% in the first half of 2009. For people ages 65 and older, the rate increased from 12.0% in 1995 to 13.0% in 2000 and then to 17.3% in 2009. It is notable that the increase in labor force activity in this decade has occurred in the midst of a recession in 2001, an anemic recovery, and a second, ongoing, recession.8
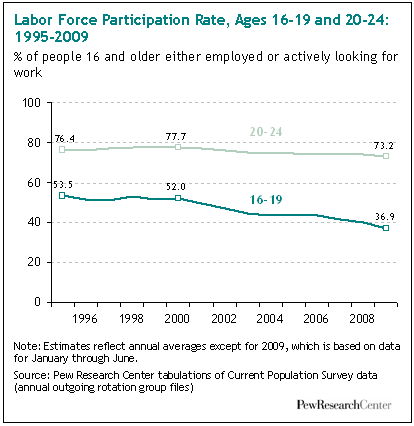
Labor market activity among young people has diminished sharply in this decade. During the heart of the economic expansion in the 1990s, labor force participation among those ages 16 to 24 held steady, 66.1% in 1995 and 65.7% in 2000. But a precipitous drop has occurred in recent years, as only 56.7% of younger people participated in the labor market in 2009, nine percentage points less than in 2000. The drop was led by the youngest. Labor force participation for teens — ages 16 to 19 — plunged from 52.0% in 2000 to 36.9% in 2009.9
The aging of the work force is due in part to greater activity on part of the “new” older generation. The charts below show the trends in labor force participation for people who turned 65 and older in 1995 and for those who entered that age cohort in 2000 and 2005. Only 12.0% of those who turned 65 and older in 1995 were active in the labor force at that time. As this cohort aged to 79 and older by 2009, the labor force participation rate decreased to 5.3%.10
People who turned 65 and older in 2000 show a clear tendency to work more than the preceding cohort. In 2000, 13.0% of those who turned 65 and older were still in the labor force. At each successive age, this cohort is more active in the labor force than were those who turned 65 and older in 1995. At ages 74 and older, 7.9% of the 2000 cohort was still active in the labor force, compared with 6.7% of the 1995 cohort.
The chart also shows that those who turned 65 and older in 2005 have an even greater tendency to remain in the labor force. The labor force participation rate for this cohort is notably higher at the same ages than for the other cohorts and shows no sign of converging in the near future.
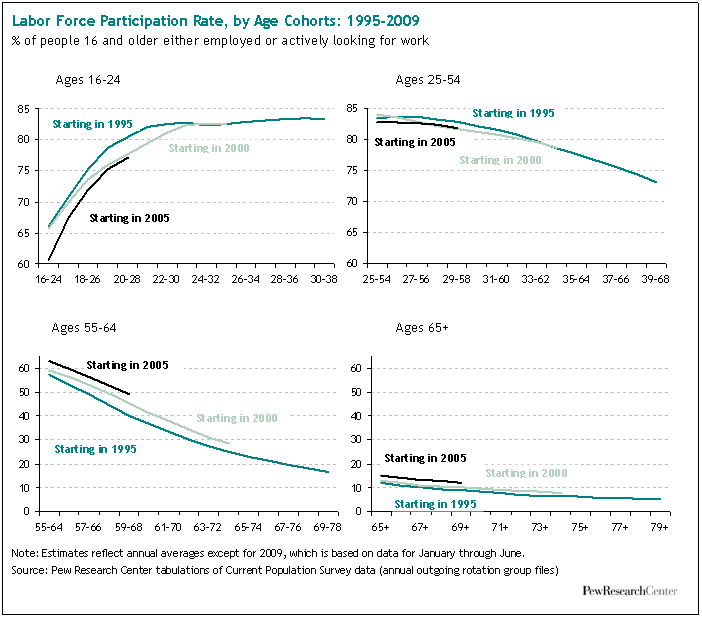
The patterns for adults ages 65 and older are also evident for adults ages 55 to 64. As shown in the charts, those who turned 55 to 64 in 2005 are more likely to participate in the labor force compared with earlier cohorts at comparable ages.
Conversely, newer cohorts of youth — those turning 16 to 24 in 2005 — are less likely than preceding cohorts to be in the labor force. For example, the labor force participation rate for the cohort that turned 16 to 24 in 2005 was 60.7%, compared with a rate of 65.7% for the cohort that turned 16 to 24 in 2000. However, as schooling is completed, and the cohorts age to 20 to 28, the gap between them disappears.
Men and Women
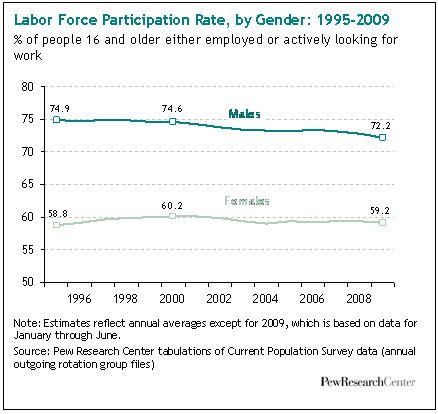
The great convergence in labor force activity among men and women over the past half century has slowed dramatically in the past 15 years. In 1948, the earliest year for which BLS reports labor market data, men were more than two and a half times as likely as women to participate in the labor market — 86.6% compared with 32.7%. The divide narrowed steadily for the next 50 years as the rate for women rose sharply and the rate for men slipped continuously.11
For women, labor force participation increased the most in the 1970s and 1980s, from 43.3% in 1970 to 57.4% in 1989. Increases in the labor force participation rate for women slowed in the 1990s, and the rate peaked at 60.0% in 1999, according to BLS.12
In light of the historic trends, it is a notable development that labor force activity among men and women has proceeded on parallel tracks for the past 15 years — generally flat or increasing modestly from 1995 to 2000 and decreasing since then. The principal difference is that the decrease in labor force participation among men has been sharper in recent years, especially in the current recession. For men, the labor force participation rate dropped from 73.1% in 2007 to 72.2% in 2009. For women, the rate fell only from 59.4% in 2007 to 59.2% in 2009.
The more dramatic fall in labor force activity among men most likely reflects the nature of the current recession. Job losses in male-dominated sectors such as construction and manufacturing have been severe, while education and health services have continued to grow.13 Thus, the rise in unemployment has tilted male. From December 2007 to July 2009, the unemployment rate for men rose from 5.0% to 10.5% on a seasonally adjusted basis, according to BLS. Over the same time, the rate for women rose much less, from 4.8% to 8.1%.14 Facing more daunting job prospects, men are currently more likely than women to drop out of the labor force and join the ranks of marginally attached workers.
Women with Children Younger than 18
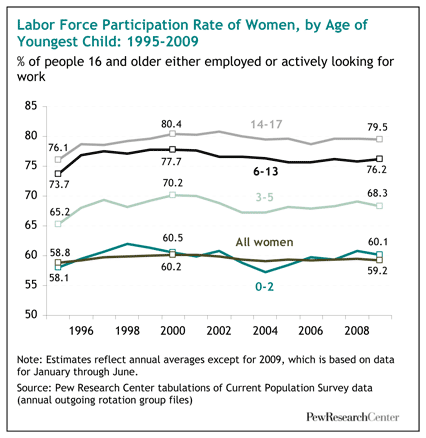
The sharp increase in the labor force participation among women in the 1970s and 1980s was driven in large part by the movement into the job market by married women with children at home.15 In the 1990s, there were also sharp increases in labor force participation among single mothers, increases that appear to have been driven by a combination of the 1996 welfare reform act and a tight labor market. The current decade is largely one of no change for women who have one or more children younger than age 18. A slight dip in labor force participation after the 2001 recession has been followed by a modest increase in the past few years.
Generally speaking, women with one or more children younger than age 18 are more likely than other women to be in the labor force. That is because women with young children are more likely than other women to be in the prime of their working years (ages 25 to 54).16
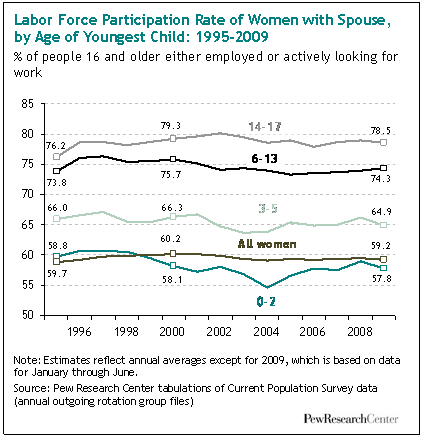
The age of a child has a clear impact on a woman’s decision to enter the labor market. About 60% of women whose youngest child is less than 2 years old are in the labor force. The labor force participation rate of these women closely parallels the participation rate for all women. As the age of the youngest child increases, women become more likely to enter the labor force. About 80% of women with children of high school age (ages 14 to 17) are active in the labor force.
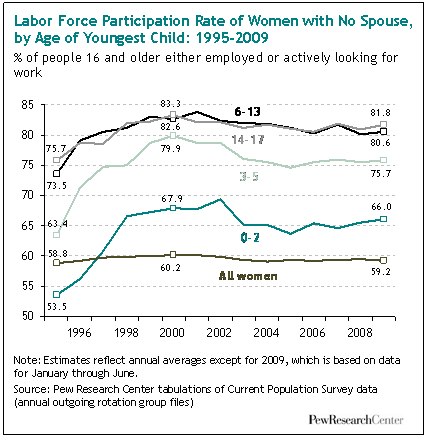
Regardless of the age of a woman’s youngest child, labor force activity among women moved up and down along similar paths from 1995 to 2009. Labor force participation rates peaked around 2000, decreased in the 2001 recession and recovered modestly after 2005. That is generally true whether a woman was raising a child with or without a spouse present.
However, a woman raising a child without a spouse present is more likely to be in the labor force, regardless of the age of her youngest child. In 2000, for example, women with no spouse present and a child younger than 2 had a labor force participation rate of 67.9%. That compared with a rate of 58.1% for women with a child younger than 2 but with a spouse present. The gap — 9.8 percentage points — had narrowed only slightly by 2009. The reason for the gap appears to be the welfare reform act of 1996, which substantially raised the labor force participation rate among women raising a child without a spouse present.
There is one additional difference between women raising at least one child with or without a spouse present. The labor market activity of those without a spouse present has been slightly boosted in spite of, or perhaps because of, the ongoing recession. That is true regardless of the age of the youngest child. Overall, the labor force participation rate for all women with a child and no spouse present increased from 75.8% in 2008 to 76.2% in 2009.
Meanwhile, women with at least one child and a spouse present have generally lowered their labor market activity in the current recession. The sole exception is women with a spouse present and a youngest child ages 6 to 13. But overall, the labor force participation rate for women with a child and a spouse present decreased from 69.4% in 2008 to 68.9% in 2009.


