Overview
The American work force is graying — and not just because the American population itself is graying. Older adults are staying in the labor force longer, and younger adults are staying out of it longer. Both trends took shape about two decades ago. Both have intensified during the current recession. And both are expected to continue after the economy recovers. According to one government estimate, 93% of the growth in the U.S. labor force from 2006 to 2016 will be among workers ages 55 and older.
Demographic and economic factors explain some — but not all — of these changes. Attitudes about work also play an important role — in particular, the growing desire of an aging but healthy population to stay active well into the later years of life.
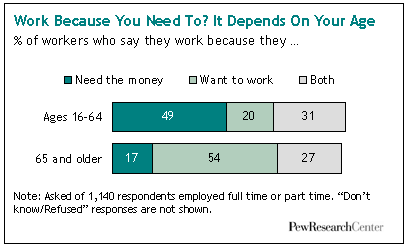
A new nationwide survey by the Pew Research Center’s Social & Demographic Trends project finds that a majority (54%) of workers ages 65 and older say the main reason they work is that they want to. Just 17% say the main reason is that they need the paycheck. An additional 27% say they’re motivated by a mix of desire and need.
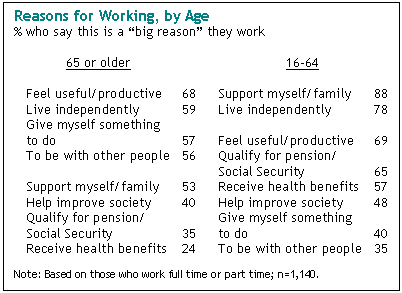
When asked to identify specific reasons for working, older workers emphasize psychological and social factors: “to feel useful”; “to give myself something to do”; “to be with other people.” Younger and middle-aged workers are much more inclined to cite classic pocketbook considerations: “to support myself and my family”; “to live independently”; “to qualify for retirement benefits”; “to receive health care benefits.”
To be sure, the current state of the economy has influenced nearly everyone’s calculations about work to some extent. But the recession appears to be having a very different impact, depending on age — keeping older adults in the labor force and younger ones out of it.
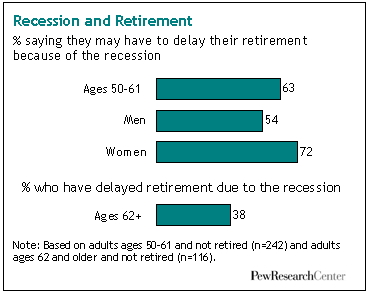
According to the Pew Research survey, nearly four-in-ten adults who are working past the median retirement age of 62 say they have delayed their retirement because of the recession. Among workers ages 50 to 61, fully 63% say they might have to push back their expected retirement date because of current economic conditions.
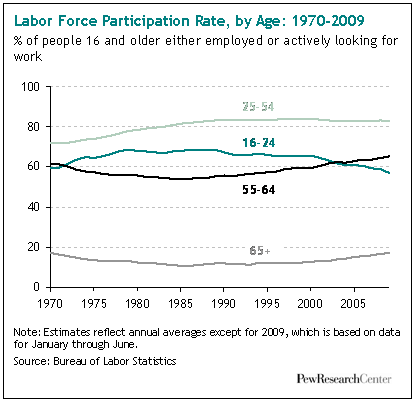
All of these survey findings are consistent with a Pew Research Center analysis of U.S. Census Bureau data that show that the labor force participation rate of older adults, which declined from 1950 until the middle of the 1980s, has been rising ever since. This trend has accelerated during this decade, especially in the current recession.
At the other end of the age spectrum, census data show that in the current decade, a rising share of Americans ages 16 to 24 are in school and a declining share are in the labor force — 57% today versus 66% in 2000.
The Pew Research survey identifies two factors that help explain these changing patterns among the young. First, a growing share of the public says that a person needs a college education to get ahead in life; about three-quarters (73%) of the public feels this way now, up from about half (49%) in 1978. Second, younger adults (like all adults) are being hit hard by the recession, and some may have become discouraged and dropped out of the labor market.
Overall, more than four-in-ten nonworking people ages 16 to 24 say they’ve looked for work but can’t find anything.
Gender Shifts
Age is not the only demographic characteristic of the work force that’s changing. There are also new developments on the gender front — but here, the most compelling story of the decade is not the presence of change but the absence of change.
After marching steadily upward for five decades, the labor force participation rate of women has essentially flattened out. It now stands at 59%, slightly below the 60% peak it reached in 2000 at the end of a period of robust economic growth, and about 13 percentage points below the current rate for men.
Even in an era of growing gender parity in the workplace, the work/family trade-off continues to be much more complicated for women than for men. The Pew Research survey dramatizes these disparities; it finds that nonworking women are nine times as likely as nonworking men to cite the tug of family responsibility as a key reason for not having a job. The survey also finds that only a small share of the public — 12% — thinks the ideal situation for a mother of young children is to work full time outside the home.
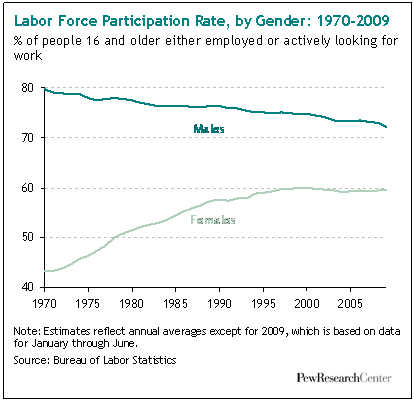
As for men, their labor force participation rate has declined in this decade — just as it has every decade since the Bureau of Labor Statistics began keeping such records in 1948. As of June 2009, it stood at 72%, the lowest level in modern history. The current economic downturn has hit men harder than women, with men suffering about two-thirds of all recession-related job losses. As often happens in a recession, a portion of these newly unemployed workers have become discouraged about finding jobs and have dropped out of the labor force altogether.
Other Findings
This report is based on a Pew Research Center analysis of long-term trends in survey data from the U.S. Census Bureau as well as on Pew Research’s own survey of a representative national sample of 1,815 people ages 16 and older conducted from July 20 to Aug. 2, 2009. Among its other key findings:
- Security trumps salary. By a ratio of nearly two-to-one, survey respondents say they would prefer a job that offers better security (59%) over one that offers higher pay (33%) but less stability. It’s not the recession that drives this preference. A similar question asked by the General Social Survey in 1989 (when the economy was in the midst of an expansion) produced a similar result.
- Despite tough times, job satisfaction remains high. Even in the face of widespread layoffs, pay freezes and involuntary furloughs, nine-in-ten employed adults say they are either completely (30%) or mostly (60%) satisfied with their job. In recent decades, levels of job satisfaction have tended to remain stable through good times and bad.
- Older workers are the happiest workers. Some 54% of workers ages 65 and older say they are “completely satisfied” with their job, compared with just 29% of workers ages 16 to 64. The explanation lies in figures cited above — a high percentage of these workers are working because they want to, not because they need to.
- Retirement is not always voluntary. Only about half (51%) of all current retirees say they retired because they wanted to. About a third (32%) say they had to retire for health or other reasons, and about one-in-ten (9%) say their employer forced them to retire.
- Even so, retirement gets high marks. More than half of all retirees (57%) say their retirement has turned out to be very satisfying; an additional 23% say it has been fairly satisfying. Only about one-in-six describe retirement as not too (10%) or not at all (6%) satisfying.
- The public is skeptical about full-time working moms. Just 14% of men and 10% of women say that a full-time job is the “ideal” situation for a woman who has a young child. A plurality of the public (44%) say a part-time job is ideal for such a mother, while a sizable minority (38%) say the ideal situation is for her not to work outside the home at all.
- Most working moms would rather have a part-time job. Among mothers of young children who have a full-time job outside the home, six-in-ten (61%) say they would prefer to work part time. By contrast, just 19% of fathers who have a full-time job and a young child say they would prefer to work part time.
Continue reading the full report at pewresearch.org/pewresearch-org/social-trends.


