Today’s mothers of newborns are more likely than their counterparts two decades earlier to be ages 35 and older, to have some college education, to be unmarried or to be nonwhite — but not all at once.
A recent Pew Research Center report on changes in the demographic characteristics of mothers of newborns found that from 1990 to 2008 the proportion of new mothers ages 35 or older rose to 14% from 9%; that the nonwhite share rose to 47% from 35%; and that the unmarried share rose to 41% from 28%. Thanks in part to rising educational attainment, more than half of mothers of newborns (54% in 2006) have at least some college education, compared with 41% in 1990.
It may be tempting to blend these four rising traits into a description of a “typical mother,” but there is no such thing. Among total U.S. births in a year, less than 1% are to unmarried, nonwhite women who are ages 35 and older and have at least some college education, according to a Pew Research Center analysis of 2006 statistics.
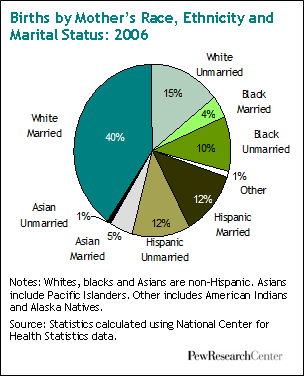
The proportion rises to only 1% if you count mothers of newborns who are 35+, unmarried and with any education beyond high school and about 1.5% for mothers who are 35+, unmarried and nonwhite. Removing the 35+ age restriction so as to include all women who unmarried, nonwhite and have any education beyond high school still yields only 5% of births in 2006. It is only when just two of these major characteristics are combined — for example race or ethnicity and marital status, as shown in the accompanying pie chart — that double-digit shares are achieved.
Combinations of Characteristics
Demographic characteristics generally travel in packs — that is, certain characteristics often are found in the same people who have other specific characteristics. One reason that so few mothers embody all four of the rising demographic trends of mothers is that those four do not tend to hang together. For example, although mothers of newborns in all age groups are more likely to be unmarried now than in 1990, the rise of this trend is larger for mothers under age 35 than for mothers ages 35 and older.
According to the recent “New Demography of American Motherhood” report, 44% of mothers of newborns who were under age 35 were unmarried in 2008, a 51% increase from 1990. Among mothers of newborns who were ages 35 and older, 19% were unmarried in 2008, an increase of 30% from 1990.
Thus, the single older mother, though somewhat more prevalent than two decades ago, is a relative rarity. In 2006, only 2% of babies were born to unmarried women ages 35 and older.
 Or, to consider marital status again, the likelihood of being unmarried is much higher for less-educated mothers than for mothers with some college education. Among women with any education beyond high school, only a small share of mothers of newborns (20% in 2006) is unmarried. Among high school graduates or those without a high school education, only 43% of the mothers of newborns are married.
These numbers demonstrate that the rising trends of unmarried motherhood and college-educated motherhood primarily apply to different subgroups of women. Only 10% of mothers of newborns in 2006 were unmarried and had some education beyond high school.
If there is no typical mother who embodies all four rising demographic traits, is there a typical mother based on any pair of traits from the fields of age, marital status, race or ethnicity and education? Here, in some cases, the answer is yes.
For example, using combinations of marital status and race or ethnicity, the largest group-accounting for 40% of births in 2006 is white, married women. As the previous pie chart shows, no other group accounts for even half that share.
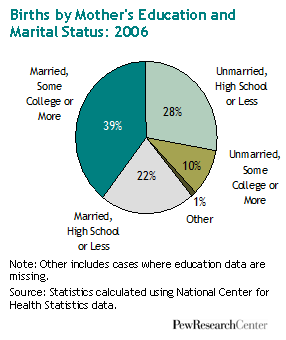
Looking at mothers based on marital status and educational attainment, the largest group is married women with at least some college education, who accounted for 39% of births in 2006. The next largest group, unmarried women with a high school education or less, made up 28% of mothers of newborns. Married women with a high school education or less made up 22% of mothers of newborns, and unmarried women with at least some college education accounted for 10%.
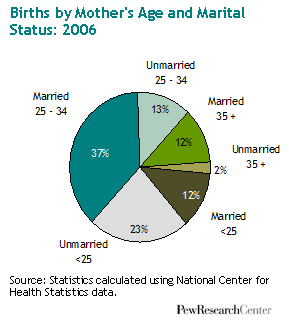 An analysis that used three age categories combined with marital status finds that the group with the highest share of births was married women ages 25-34, who were 37% of mothers of newborns in 2006. Unmarried women in the youngest age category (under 25) accounted for 23% of births. At the low end, only 2% of births were to unmarried women ages 35 and older — the so-called “Murphy Browns,” named for the TV character who became a single mother in 1992.
For other pairs of characteristics, no one group rises above about a third of all mothers. Looking at combinations of race or ethnicity and education, the largest group is white women with at least some college education, who accounted for 34% of births in 2006. Looking at educational attainment combined with three age categories, women ages 25-34 with at least some college education accounted for 30% of births. Using race or ethnicity and three age categories, the largest group is white women ages 25-34, who accounted for 29% of births in 2006. See this table for the complete set of numbers.


