I. Overview
The Great Recession has divided America into two groups that are roughly the same size but that experienced very different economic downturns.
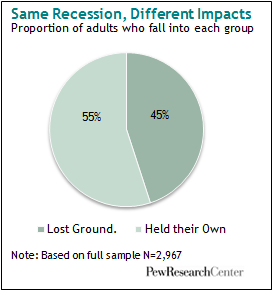
For a narrow majority of Americans (55%), the Great Recession brought a mix of hardships, usually in combination: a spell of unemployment, missed mortgage or rent payments, shrinking paychecks and shattered household budgets, according to a recent survey by the Pew Research Center’s Social & Demographic Trends project. But for the other 45% of the country, the recession was largely free of such difficulties.
These two groups differ in their demographic makeup. About seven-in-ten retirees and other older adults largely held their own during the recession, while an equally lopsided majority of 20-somethings did not. Where you live also is associated with how well you fared during hard times: Easterners are significantly more likely than residents of the South, West or Midwest to have better weathered the economic storm. At the same time, suburban and rural residents experienced fewer problems than city dwellers.
Republicans, too, are somewhat disproportionally represented among those who had an easier passage through hard times, while Democrats and political independents are more likely to have lost ground. And as other research has consistently shown, a college diploma is a strong shield against hard times: nearly six-in-10 college graduates count themselves among the 45% who experienced fewer difficulties during the recession, compared with 38% of those whose educational attainment was a high school diploma or less.
This portrait emerges from an analysis of survey data collected from a national representative sample of 2,967 respondents interviewed May 11-31, 2010.1 Using a statistical technique called cluster analysis, the sample was grouped on the basis of how the respondents answered eight questions designed to measure the economic hardships Americans experienced as a result of the Great Recession.2The recession officially began in December 2007 and was recently determined to have ended in June 2009.
The remainder of this report examines the two groups — those who Lost Ground and those who Held their Own — in more detail. The first section examines the different ways the recession affected each group; the second section provides group demographic profiles; the third section looks at how the two groups differ in their experiences on the job; and a final section examines the different ways the groups view the economy.
It is important to understand the limitations of this analysis. Not everyone in each cluster answered each question in exactly the same way. But overall, members of each group are more similar to each other in terms of their responses to the questions than they are to those in the other group. Also, while these two clusters describe these data well, different questions or questions that more precisely measured recession-related harms may have further divided these two major groupings into smaller, even more sharply defined groups. The survey, for example, asked whether an individual owned stocks, bonds or other investments but did not ask for precise estimates of changes in the value of investment holdings. Had such questions been asked, the number, size or the characteristics of the clusters may have been somewhat different.
One final caveat: This analysis is not intended to assert or imply that those in the Held their Own group suffered no economic reversals. In a recession such as this — featuring not just high unemployment but also a bursting of the stock market and housing bubbles — nearly everyone got hurt in one way or another. However, the questions that form the basis of this cluster analysis were designed to measure serious economic hardship. So, for example, someone who saw the value of a home decline but who did not experience the sort of day-to-day financial strains and behavioral changes measured by this survey would wind up in the Held their Own cluster.
About the Survey
Results for this survey are based on telephone interviews conducted with a nationally representative sample of 2,967 people ages 18 and older living in the continental United States. A combination of landline and cellular random digit dial (RDD) samples was used to represent all adults in the continental United States who have access to either a landline or cellular telephone. A total of 1,893 interviews were completed with respondents contacted by landline telephone and 1,074 with those contacted on their cell phone. The data are weighted to produce a final sample that is representative of the general population of adults in the continental United States.
- Interviews conducted May 11-31, 2010
- 2,967 interviews, including 1,761 respondents in the group that Lost Ground and 1,184 who Held their Own.
- Margin of sampling error is plus or minus 2.2 percentage points for results based on the total sample at the 95% confidenence level, 3.3 points for the group that Lost Ground and 4.0 points for those who Held their Own.
- Survey interviews were conducted under the direction of Princeton Survey Research Associations International. Interviews were conducted in English or Spanish.


