About the General Public Survey
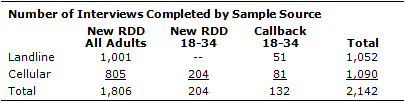
Results for the general public survey are based on telephone interviews conducted March 15-29, 2011 among a national sample of 2,142 adults 18 years of age or older living in the continental United States (a total of 1,052 respondents were interviewed on a landline telephone, and 1,090 were interviewed on a cell phone, including 544 who had no landline telephone). The survey was conducted by interviewers at Princeton Data Source under the direction of Princeton Survey Research Associates International (PSRAI). Interviews were conducted in English and Spanish. A combination of landline and cell phone random digit dial (RDD) samples were used; both samples were provided by Survey Sampling International. The landline RDD sample was drawn using traditional list-assisted methods where telephone numbers were drawn with equal probabilities from all active blocks in the continental U.S. The cell sample was drawn through a systematic sampling from dedicated wireless 100-blocks and shared service 100-blocks with no directory-listed landline numbers. Both the landline and cell RDD samples were disproportionately stratified by county based on estimated incidences of African-American and Hispanic respondents. Additional interviewers were obtained with 18-34 year-olds through a combination of additional screening in the cell phone RDD sample, and by re-contacting landline and cell phone respondents ages 18-34 from recent surveys conducted by PSRAI.
Both the landline and cell samples were released for interviewing in replicates, which are small random samples of each larger sample. Using replicates to control the release of telephone numbers ensures that the complete call procedures are followed for all numbers dialed. At least 7 attempts were made to complete an interview at every sampled telephone number. The calls are staggered over times of day and days of the week (including at least one daytime call) to maximize the chances of making contact with a potential respondent. An effort is made to recontact most interview breakoffs and refusals to attempt to convert them to completed interviews.
Respondents in the landline sample were selected by randomly asking for the youngest adult male or female who is now at home. Interviews in the cell sample were conducted with the person who answered the phone, if that person was an adult 18 years of age or older. The additional interviews with 18-34 year-olds from the cell sample were administered an age screener; those who were in the target age range completed the interview. For the landline callback sample, interviewers asked to speak with the person based on age and gender who participated in an earlier survey. For the cellular callback sample, interviews were conducted with the person who answered the phone once it was confirmed that they were in the target age range.
Weighting is generally used in survey analysis to adjust for effects of sample design and to compensate for patterns of nonresponse that might bias results. The weighting was accomplished in multiple stages to account for the different sample frames as well as the oversampling of 18-34 year-olds. Weighting also balances sample demographic distributions to match known population paramaters.
The first stage of weighting accounted for the disproportionately-stratified RDD sample design of the landline and cell samples. In addition, this stage included an adjustment to account for the oversampling of 18-34 year-olds. The first stage weight also included a probability-of-selection adjustment for the RDD landline sample to correct for the fact that respondents in the landline sample have different probabilities of being sampled depending on how many adults live in the household (i.e., people who live with no other adults have a greater chance of being selected than those who live in multiple-adult households). Lastly, this stage of weighting also accounted for the overlap in the landline and cellular RDD frames.
In the second stage of weighting, the combined sample was weighted using an iterative technique that matches gender, age, education, race, Hispanic origin, and region to parameters from the March 2010 Census Bureau’s Current Population Survey. The population density parameter is county based and was derived from 2000 Census data. The sample also is weighted to match current patterns of telephone status and relative usage of landline and cell phones (for those with both), based on extrapolations from the 2010 National Health Interview Survey.
The survey’s margin of error is the largest 95% confidence interval for any estimated proportion based on the total sample – the one around 50%. For example, the margin of error for the entire sample is plus or minus 2.7 percentage points. This means that in 95 out of every 100 samples drawn using the same methods, estimated proportions based on the entire sample will be no more than 2.7 percentage points away from their true values in the population. Sampling errors and statistical tests of significance take into account the effect of weighting. The following table shows the sample sizes and the error attributable to sampling that would be expected at the 95% level of confidence for different groups in the survey:
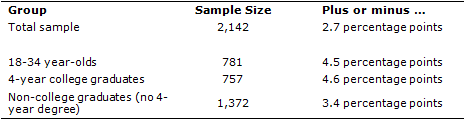
Sample sizes and sampling errors for other subgroups are available upon request.
In addition to sampling error, one should bear in mind that question wording and practical difficulties in conducting surveys can introduce error or bias into the findings of opinion polls.
About the College Presidents Survey
Results for the college presidents survey are based on interviews conducted from March 15-April 24, 2011 among 1,055 college and university presidents under the direction of Princeton Survey Research Associates International. Interviewing was primarily self-administered online by college presidents, however, a phone interview option was made available to any president who requested it (1,022 interviews were completed online and 33 by telephone). The college presidents survey was done by the Pew Research Center’s Social and Demographic Trends Project in association with the Chronicle of Higher Education (Chronicle). The list of college presidents was compiled by the Chronicle from the Higher Education Directory and the Integrated Postsecondary Education Data System. The population for this study is college and university presidents of public and private (for-profit and not for profit—NFP) institutions in the U.S. that meet the following criteria: 1) degree granting, 2) have received accreditation or pre-accreditation status from a recognized accrediting agency, and 3) had a minimum enrollment of 500 students in the fall of 2009. Institutions in U.S. territories, military institutions, graduate-only institutions, system offices and CEOs of for-profit parent companies were excluded from the survey. Presidents of institutions who oversee multiple eligible locations and branches were included but were only asked to complete the survey once. The final list, after the above institutions were excluded and presidents who oversee multiple locations were counted only once, included 3,324 college and university presidents.
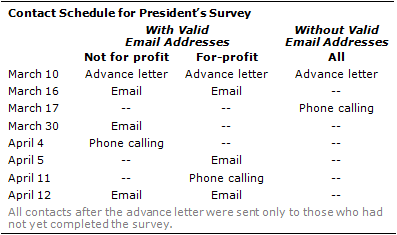
All 3,324 presidents on the list were contacted to complete the survey. Each president was mailed a letter on stationary with logos of both the Pew Research Center and The Chronicle of Higher Education on March 10, 2011. The letter was signed by Paul Taylor, Executive Vice President of the Pew Research Center and Jeffrey J. Selingo, Editor for The Chronicle of Higher Education. This letter was intended to introduce the survey to prospective respondents, describe the nature and purpose of the survey and encourage participation in the survey. The initial letter contained a URL and a password for a secure website where the survey could be completed. The letter also included a toll-free number for respondents to call if they had questions.
Subsequent requests to complete the survey were sent primarily by email to those who had not yet responded. Three email requests to complete the survey were sent to those who had not yet responded and could be contacted by email (over 90% had working email addresses) on March 16th (to NFP and for-profit), March 30th (to NFP), April 5th (to for-profit) and April 12th (to NFP and for-profit). On March 17th, interviewers at Princeton Data Source began calling those without email addresses, as well as those whose email requests had bounced back as undeliverable, in an effort to gather working email addresses and encourage participation online. On April 4th (for NFP) and April 11th (for for-profit) phone calling began to all presidents who had not yet completed the survey, to encourage participation online.
Although all of the presidents were asked to complete the survey, only some of them responded. A total of 1,055 of the 3,324 presidents surveyed completed the interview for a response rate of 32% (see table below for response rates by sector). Nonresponse in surveys can produce biases in survey-derived estimates because participation may vary for different groups, who may differ on questions of substantive interest. In order to correct for these biases, weighting is often employed. The final data was weighted using an iterative technique to match distributions for sector and region to population distributions. The weighting was employed to help correct for disproportionate non-response that might bias sample estimates. Margins of error and statistical tests of significance take into account the effect of weighting. The following table shows the response rates, sample sizes and margins of error that would be expected at the 95% level of confidence for different groups in the survey:
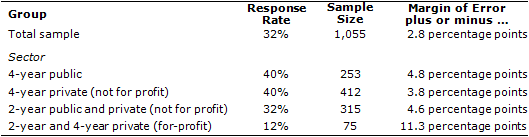
The above margins of error include a finite population correction to account for the fact that presidents were surveyed without replacement from a relatively small finite population.
One should also bear in mind that question wording and practical difficulties in conducting surveys can introduce error or bias into the findings of opinion polls.


