Data Sources
The net worth and asset ownership levels are tabulated from the U.S. Census Bureau’s Survey of Income and Program Participation. SIPP is a longitudinal survey designed to follow a given panel of households over several years. The panels are nationally representative samples of the civilian, non-institutionalized population of the United States and are selected anew every few years. The two panels utilized in this report are the 2004 panel, interviewed from 2004 to 2008, and the 2008 panel, interviews scheduled to last from 2008 to 2012.
Each SIPP panel is divided into four interview groups. A complete cycle of interviews lasts for four months, one interview group per month, and is referred to as a “wave.” A single wave typically features a different set of questions referred to as “topical modules.”
The 2009 wealth data comes from wave 4 of the 2008 SIPP panel. These interviews, for the assets and liabilities topical module, occurred from September 2009 to December 2009. The group interviewed in September 2009 was asked about its assets and liabilities as of the last day of August. The group interviewed in October was queried about its net worth as of the last day of September, and so on. Thus, the 2009 snapshot presented in this report is a composite of the assets and liabilities of households as of August, September, October and November 2009.
The 2005 wealth data derives from wave 6 of the 2004 SIPP panel. That cycle of interviews was conducted from October 2005 to January 2006. Thus, the 2005 wealth estimates are a composite of the assets and liabilities of households as of September, October, November and December 2005.
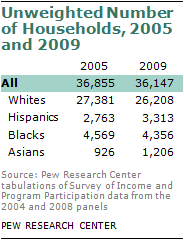
SIPP, along with the Survey of Consumer Finances (SCF) and the Panel Survey of Income Dynamic (PSID), is one of the leading sources of data on household wealth. One of its advantages is that each panel consists of about 35,000 households. Because of the large sample in the SIPP panels, minority households are well represented.
SIPP asks a detailed set of questions on the assets and liabilities of every member of the household. However, not all possible assets are captured in the interviews. The major assets that are not included in the estimates of net worth are equities in defined benefit pension plans and the cash value of life insurance policies, as well as the value of jewelry and home furnishings.
SIPP has been collecting detailed wealth data periodically since 1984 and the U.S. Census Bureau periodically issues a major report on the nation’s wealth based on SIPP. The latest published report is Net Worth and the Assets of Households: 2002, issued in April 2008. Detailed information on SIPP data is available at the U.S. Census Bureau’s SIPP website, http://www.census.gov/sipp/index.html.
Data from SIPP are subject to sampling and nonsampling errors. The Census Bureau has published standard errors for estimates of median net worth for 2004 (www.census.gov/hhes/www/wealth/2004_tables.html). Those imply the following margins of error (in 2009 dollars) at the 90% confidence interval: for non-Hispanic whites, +/- $804; for Hispanics, +/- $712; for blacks (including Hispanics), +/- $431; and for Asians (including Hispanics), +/- $11,233.
The margins of error may be used to derive approximate upper and lower bounds for the wealth estimates in this report. For example, the median net worth of white households in 2005 is estimated to be $134,992 (in 2009 dollars). The margin of error suggests that we can be 90% certain the true value of the net worth of white households lies within the range from $134,188 to $135,796. It is necessary to note, however, that the Census Bureau includes Hispanics in the racial categories black and Asian; the estimates in this report do not.
The margins of error reported by the Census Bureau for the 2004 estimates are only an approximate guide to the variance in the 2005 and 2009 estimates contained in this study. Also, margins of error cannot be directly applied to determine whether the median net worth of one group overlaps with the net worth of another group. Determining the significance of the difference in net worth between groups requires the application of a test of significance designed for that purpose. Standard errors for median wealth estimates from the 2008 SIPP panel are not yet available.
Interpreting Changes in Wealth over Time
In interpreting the changes in wealth from 2005 to 2009, it is necessary to be mindful of demographic changes that characterize rapidly growing populations such as Hispanics and Asians. The Asian population of heads of households, for example, is 81% foreign born and its growth continues to be fueled by immigration.23 This means that changes in the wealth of Asian households from 2005 to 2009 may be influenced, in part, by the arrival of new immigrants. The result is a downward pull on median wealth because newly arrived immigrants typically have very low levels of wealth.24
This report does not try to parse the extent to which changes in wealth are due to demographic change and the extent to which they are due to underlying economic trends. However, some inferences can be drawn by adjusting the 2008 SIPP panel to exclude recently arrived immigrants. Among Asian heads of households in the 2008 SIPP panel, 16% had arrived in the U.S. since 2004.25 Those Asian heads of households, along with 5% whose immigration status was unknown, were excluded from the sample. That led to a reduction in the (unweighted) sample size of Asian heads of household from 1,206 to 959, a loss of 20%. The losses for other groups are more modest.
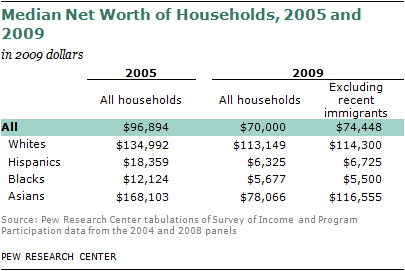
Estimates for 2009 for the full sample and based on the adjusted sample (eliminating immigrant household heads who arrived after 2003) are reported in the table. The 2009 median net worth of Hispanic, black and white households is pretty much unchanged regardless of whether recently arrived immigrant households are included. However, the median net worth for Asians significantly increases (from $78,066 to $116,555) if recently arrived immigrant households are excluded from the 2009 sample.


