Estimates of household wealth by race and ethnicity from SIPP are available starting in 1984. The time series is not entirely consistent because of a redesign of the SIPP panel in 1996 and changes to the racial identity question in 2004.18 Subject to these two caveats, the latest estimates indicate that the wealth of Hispanic and black households in 2009 is at its lowest level in at least 25 years. Furthermore, the wealth gaps between white and Hispanic households and white and black households are at their highest level in recent economic history.
Among Hispanics, net worth last dipped to about $7,000 in 1993. In other years from 1984 to 1995, their net worth was about $10,000, increasing to about $15,000 in 2004. For black households, net worth was in the range of $6,500 to $10,000 from 1984 to 2004, but it dropped to about $5,000 in 2009. The experience of white households is different. Despite the steep decline in wealth from 2004 to 2009, their net worth remains higher than the levels that existed from 1984 to 1995.19
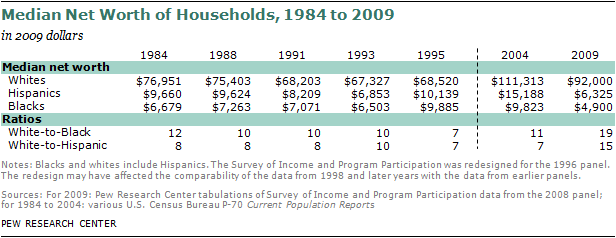
As a result of the disparate trends in net worth by racial and ethnic groups, the ratios of the wealth of white households to the wealth of black and Hispanic households are at their highest levels since at least 1984. These ratios were about 10-to-1 in favor of whites from 1984 to 2004. From 2004 to 2009, the white-to-Hispanic and the white-to-black wealth ratios doubled to about 20-to-1.
Evidence from Other Sources
The SIPP is considered the most comprehensive source of data about household wealth by race and ethnicity in the United States, but it is not the only source. Two other surveys provide periodic snapshots—the Survey of Consumer Finances (SCF) and the Panel Study of Income Dynamics (PSID).
The SCF has been conducted triennially by the Federal Reserve Board since 1989. However, wealth data from these surveys are broken down into only two broad racial and ethnic groups: non-Hispanic white households and all other nonwhite or Hispanic households.
As with the SIPP, the wealth ratios from the SCF displayed a generally consistent level for the two decades prior to the Great Recession. In 1989, the wealth of non-Hispanic white households was estimated to be 12 times as high as the wealth of nonwhite or Hispanic households. However, the ratio fell to six by 1992 and remained at that level through 2007. There was a short-lived rise to seven in the level of the ratio in 2001.20 The wealth ratios estimated from officially published SCF data are generally lower than those from SIPP because the nonwhite group includes Asians, a high wealth group. The Pew Research Center used the SCF to tabulate the net worth of non-Hispanic white, non-Hispanic black and Hispanic households in 2004 and 2007. The white-to-Hispanic wealth ratio was nine in 2004 and eight in 2007. The white-to-black wealth ratio was seven in 2004 and 10 in 2007.
The Federal Reserve Bank has also released a preliminary estimate of the change in household wealth from 2007 to 2009. Based on a subsample of the 2007 panel, the Fed reports that median household wealth decreased by 18% from 2007 to 2009. Post-recession estimates by race and ethnicity are not yet available from the SCF.21
The PSID is conducted by the Institute for Social Research at the University of Michigan. It is a longitudinal study of U.S. households and was started in 1968 with a sample of about 5,000 families. Estimates made by the Center from a preliminary release of 2009 PSID data show that the median net worth of all households decreased by 19% from 2007 to 2009. The decrease in the wealth of Hispanic households (52%) and black households (30%) was greater than the 9% decrease in the net worth of white households.22


