Executive Summary
The median wealth of white households is 20 times that of black households and 18 times that of Hispanic households, according to a Pew Research Center analysis of newly available government data from 2009.
These lopsided wealth ratios are the largest since the government began publishing such data a quarter century ago and roughly twice the size of the ratios that had prevailed between these three groups for the two decades prior to the Great Recession that ended in 2009.
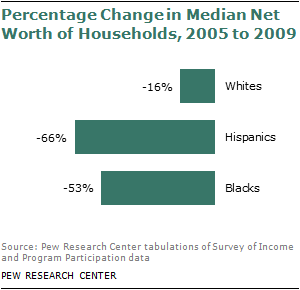
The Pew Research analysis finds that, in percentage terms, the bursting of the housing market bubble in 2006 and the recession that followed from late 2007 to mid-2009 took a far greater toll on the wealth of minorities than whites. From 2005 to 2009, inflation-adjusted median wealth fell by 66% among Hispanic households and 53% among black households, compared with just 16% among white households.
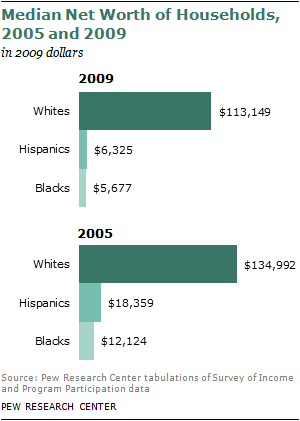
As a result of these declines, the typical black household had just $5,677 in wealth (assets minus debts) in 2009; the typical Hispanic household had $6,325 in wealth; and the typical white household had $113,149.
Moreover, about a third of black (35%) and Hispanic (31%) households had zero or negative net worth in 2009, compared with 15% of white households. In 2005, the comparable shares had been 29% for blacks, 23% for Hispanics and 11% for whites.
Hispanics and blacks are the nation’s two largest minority groups, making up 16% and 12% of the U.S. population respectively.
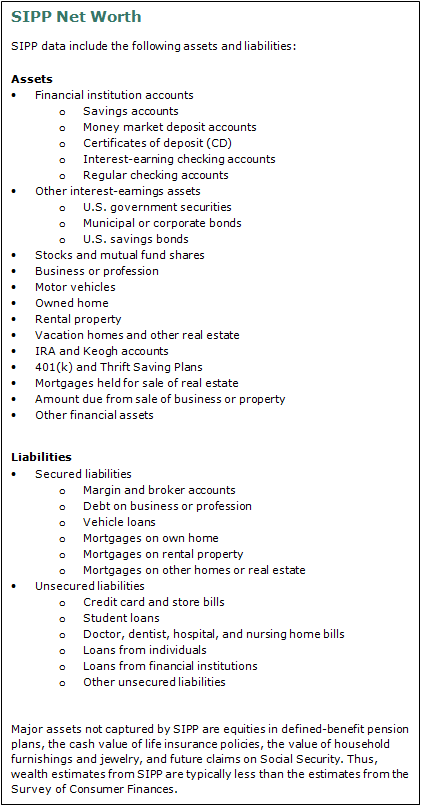
These findings are based on the Pew Research Center’s analysis of data from the Survey of Income and Program Participation (SIPP), an economic questionnaire distributed periodically to tens of thousands of households by the U.S. Census Bureau. It is considered the most comprehensive source of data about household wealth in the United States by race and ethnicity. The two most recent administrations of SIPP that focused on household wealth were in 2005 and 2009. Data from the 2009 survey were only recently made available to researchers.1
Plummeting house values were the principal cause of the recent erosion in household wealth among all groups, with Hispanics hit hardest by the meltdown in the housing market.
From 2005 to 2009, the median level of home equity held by Hispanic homeowners declined by half—from $99,983 to $49,145—while the homeownership rate among Hispanics was also falling, from 51% to 47%. A geographic analysis suggests the reason: A disproportionate share of Hispanics live in California, Florida, Nevada and Arizona, which were in the vanguard of the housing real estate market bubble of the 1990s and early 2000s but that have since been among the states experiencing the steepest declines in housing values.
Wealth Ratios: A 25-Year History
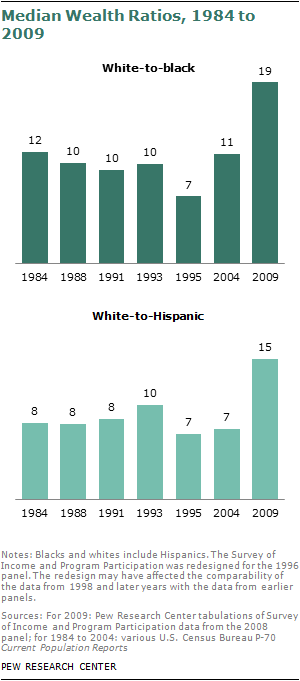
The chart to the right shows the Pew Research Center’s estimates of the wealth ratios for 2009 and those published by the Census Bureau for 1984 to 2004. As the chart demonstrates, the white-to-black and white-to-Hispanic wealth ratios were much higher in 2009 than they had been at any time since 1984, the first year for which the Census Bureau published wealth estimates by race and ethnicity based on SIPP data.
Note that the ratios shown in the chart for 2009 differ slightly from the 2009 estimates used in the rest of this report: 19-to-1 for the white-to-black ratio, compared with 20-to-1 elsewhere in the report, and 15-to-1 for the white-to-Hispanic ratio, compared with 18-to-1 elsewhere in the report. That is because, in order to make the estimates in the chart consistent over time, the 2009 figures were adjusted to allow the racial groups “white” and “black” to include Hispanic members of these groups, consistent with methods used by the Census Bureau from 1984 to 2004. In the rest of this report, the white, black (and Asian) racial groups include only the non-Hispanic components of these populations. (Changes in racial identification methods and a redesign of SIPP in 1996 may also have had an impact on the comparability of the wealth ratios over time).
White and black homeowners also saw the median value of their home equity decline during this period, but not by as much as Hispanics. Among white homeowners, the decline was from $115,364 in 2005 to $95,000 in 2009. Among black homeowners, it was from $76,910 in 2005 to $59,000 in 2009. There was little or no change during this period in the homeownership rate for whites and blacks; it fell from 47% to 46% among blacks and was unchanged at 74% among whites.2
Household wealth is the accumulated sum of assets (houses, cars, savings and checking accounts, stocks and mutual funds, retirement accounts, etc.) minus the sum of debt (mortgages, auto loans, credit card debt, etc.). It is different from household income, which measures the annual inflow of wages, interest, profits and other sources of earning. Wealth gaps between whites, blacks and Hispanics have always been much greater than income gaps.
The 2005 to 2009 time frame allows for a before-and-after look at the impact of the Great Recession. However, those dates do not align perfectly with the downturn, which ran from December 2007 to June 2009, according to the National Bureau of Economic Research.
In 2005, both the stock and housing markets were still rising. Thus, had the base year for these measurements of wealth been closer to the top of these markets in 2006 or 2007, the recorded declines are likely to have been even steeper.
Moreover, since the official end of the recession in mid-2009, the housing market in the U.S. has remained in a slump while the stock market has recaptured much of the value it lost from 2007 to 2009. Given that a much higher share of whites than blacks or Hispanics own stocks— as well as mutual funds and 401(k) or individual retirement accounts (IRAs)—the stock market rebound since 2009 is likely to have benefited white households more than minority households.
Other key findings from the report:
Hispanics: The net worth of Hispanic households decreased from $18,359 in 2005 to $6,325 in 2009. The percentage drop—66%—was the largest among all groups. Hispanics derived nearly two-thirds of their net worth in 2005 from home equity and are more likely to reside in areas where the housing meltdown was concentrated. Thus, the housing downturn had a deep impact on them. Their net worth also diminished because of a 42% rise in median levels of debt they carried in the form of unsecured liabilities (credit card debt, education loans, etc.).
Blacks: The net worth of black households fell from $12,124 in 2005 to $5,677 in 2009, a decline of 53%. Like Hispanics, black households drew a large share (59%) of their net worth from home equity in 2005. Thus, the housing downturn had a strong impact on their net worth. Blacks also took on more unsecured debt during the economic downturn, with the median level rising by 27%.
Whites: The drop in the wealth of white households was modest in comparison, falling 16% from $134,992 in 2005 to $113,149 in 2009. White households were also affected by the housing crisis. But home equity accounts for relatively less of their total net worth (44% in 2005), and that served to lessen the impact of the housing bust. Median levels of unsecured debt among whites rose by 32%.
Asians: In 2005 median Asian household wealth had been greater than the median for white households, but by 2009 Asians lost their place at the top of the wealth hierarchy. Their net worth fell from $168,103 in 2005 to $78,066 in 2009, a drop of 54%. Like Hispanics, they are geographically concentrated in places such as California that were hit hard by the housing market meltdown. The arrival of new Asian immigrants since 2004 also contributed significantly to the estimated decline in the overall wealth of this racial group. Absent the immigrants who arrived during this period, the median wealth of Asian households is estimated to have dropped 31% from 2005 to 2009. Asians account for about 5% of the U.S. population.
No Assets: About a quarter of all Hispanic (24%) and black (24%) households in 2009 had no assets other than a vehicle, compared with just 6% of white households. These percentages are little changed from 2005.
Medians and Means: Just as the gap in median household wealth among racial and ethnic groups rose from 2005 to 2009, so too did the gap in mean household wealth. However, the mean differences are not as dramatic as the median differences. (A median is the midpoint that separates the upper half from the lower half of a given group; a mean is an average, and, in this case, the average is driven upward by households with high net worth). In 2005, mean white household wealth was 2.3 times that of Hispanics and 3 times that of blacks. By 2009, it was 3.7 times that of both Hispanics and blacks.
Wealth Disparities within Racial and Ethnic Groups: During the period under study, wealth disparities increased not only between racial and ethnic groups, they also rose within each group. Even though the wealthiest 10% of households within each group suffered a loss in wealth from 2005 to 2009, their share of their group’s overall wealth rose during this period. The increase was the greatest among Hispanics, with the top 10% boosting their share of all Hispanic household wealth from 56% in 2005 to 72% in 2009. Among whites, the share of wealth owned by the top 10% rose from 46% in 2005 to 51% in 2009. These trends indicate that those in the top 10% of the wealth ladder were relatively less impacted by the economic downturn than those in the remaining 90%.
Terminology
References to whites, blacks and Asians are to the non-Hispanic components of those populations. The only exception to this rule is when historical comparisons are drawn with data published by the Census Bureau.
“Asian” refers to (non-Hispanic) persons reporting their racial origin as Asian alone and does not include native Hawaiians or other Pacific Islanders. “Black” refers to black alone, and “white” refers to white alone.
The racial and ethnic identity of a household is determined on the basis of the racial and ethnic identity of the head of the household.
Household “net worth” is the sum of the market value of assets owned by every member of the household minus their liabilities (debt).
Unless otherwise stated, all estimates in this report are expressed in 2009 dollars.
About the Report
This report presents net worth and asset ownership figures from wave 6 of the 2004 panel of the Survey of Income Program and Participation (SIPP) and wave 4 of the 2008 SIPP panel. These waves were conducted at the end of 2005 and 2009, respectively. SIPP is a longitudinal survey of households conducted by the U.S. Census Bureau. By design, SIPP oversamples low-income households and thus surveys large numbers of minority households. SIPP has periodically collected detailed wealth data since 1984 and is considered an authoritative source on the wealth of American households. As with any survey, estimates from SIPP are subject to sampling and nonsampling errors. See the appendix for more details.
This report was edited and the overview written by Paul Taylor, executive vice president of the Pew Research Center and director of its Social and Demographic Trends project. Senior researcher Rakesh Kochhar and senior economist Richard Fry researched and wrote the report. Research assistant Seth Motel helped with the preparation of charts. The report was number-checked by Motel and Pew Research Center staff member Gabriel Velasco. The report was copy-edited by Marcia Kramer. The Center is grateful for the expeditious assistance of Nasrin Dalirazar of the Housing and Household Economic Statistics Division of the U.S. Census Bureau on the definition of SIPP net worth components, weighting issues, and the replication of wealth tabulations published by the Census Bureau.


