Executive Summary
 Without public debate or fanfare, large numbers of Americans enacted their own anti-poverty program in the depths of the Great Recession: They moved in with relatives. This helped fuel the largest increase in the number of Americans living in multi-generational households in modern history. From 2007 to 2009, the total spiked from 46.5 million to 51.4 million.
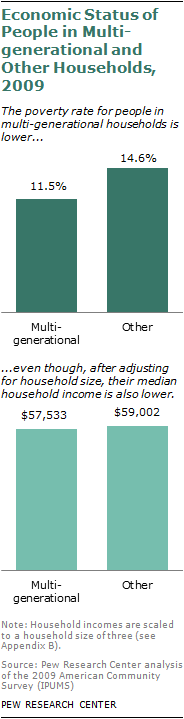
Living in a multi-generational household appears to be a financial lifeline for many. Although their adjusted incomes overall are lower, the poverty rate among people in multi-generational households is substantially smaller than for those in other households—11.5% vs. 14.6% in 2009, according to a new Pew Research Center analysis of Census Bureau data.
Moreover, the potential benefits of living in multi-generational households are greatest for the groups that have been most affected by the Great Recession. Among the unemployed, the poverty rate in 2009 was 17.5% for those living in multi-generational households, compared with 30.3% for those living in other households. Members of other economically vulnerable groups—young adults, Hispanics and blacks—who live in multi-generational households also experience sharply lower poverty rates than those in other households.1
In 2009, 11.9 million of 113.6 million households in the U.S. were multi-generational. The majority (6.9 million) consisted of two adult generations, for example, a household head with an adult child or with a parent. Slightly more than a third of multi-generational households (4.2 million) encompassed three or
more generations, for example, a householder, adult child and grandchild. The remaining multi-generational households, about 857,000, consist of two skipped generations—a grandparent and a grandchild.
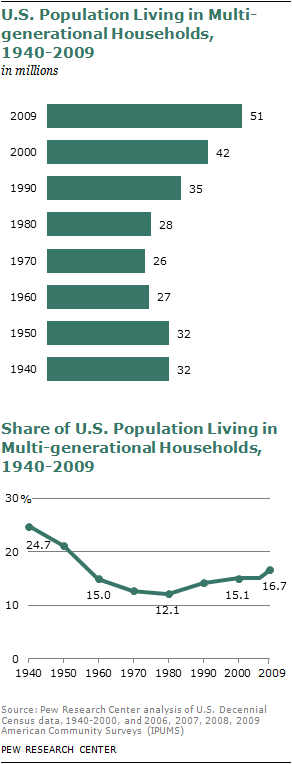 The number of Americans living in multi-generational households has been increasing since 1980, a process documented in a 2010 Pew Research report.2 Demographic forces—delayed marriages and a wave of immigration—have played a role in a steady rise, about 2% annually from 1980 to 2006.
However, in the years of the Great Recession, the multi-generational household population shot up, increasing by 4.9 million, or 10.5%, from 2007 to 2009. During this time, the overall population grew only 1.8%. As a result, the share of the population living in multi-generational households increased to 16.7% in 2009, up from 15.4% in 2007.
The current surge in multi-generational households is linked to the economy. The unemployed, whose numbers are growing, are much more likely to live in multi-generational households—25.4% did in 2009, compared with 15.7% of those with jobs. The ranks of the unemployed swelled by 7.2 million from 2007 to 2009, and the typical spell of unemployment in the Great Recession was the longest in four decades,3 adding to the financial strain on those without jobs.
A 2010 Pew Research survey also found that, during the recession, many young adults moved back in with their parents after living on their own. One-in-four of those ages 18 to 24 said they did so, and one-in-five of those ages 25 to 34 reported doing the same.4
Lack of work is a likely motive in pushing up the number of young adults living with their parents. Among young adults ages 18 to 29, the share unemployed or out of the workforce in 2010—38%—was the highest in nearly four decades.5
The recession’s impact on household finances is another factor likely to have driven the surge in multi-generational households. A recent report from the Census Bureau shows that, in 2010, the median income for U.S. households was below its 1997 level and the poverty rate—15.1%, up from 14.3% in 2009—had climbed to levels last seen in 1993.6 Under these circumstances, it is perhaps natural that more people would reach out to family for financial support.
The ability to pool financial resources is an advantage of multi-generational living, but it comes with a trade-off. Multi-generational households are relatively large—an average of 4.3 residents, compared with 2.4 in other households. After adjusting for differences in household size, incomes in multi-generational households, overall, are slightly lower than in other households.
However, there are notable exceptions where multi-generational households provide a financial advantage for some groups. Among households with one or more unemployed residents, multi-generational households had much higher median incomes in 2009 than did other households—$48,542 vs. $41,115 (incomes adjusted for differences in household size and scaled to a household of three). Similarly, size-adjusted household incomes are higher in multi-generational households headed by Hispanics, blacks and immigrants.
This report examines the growth in multi-generational households from 2007 to 2009 and the economic characteristics of those households compared with other households. The period of analysis overlaps with the Great Recession, which officially took place from December 2007 to June 2009. The research findings are based on the Pew Research Center’s analysis of microdata from the American Community Surveys (ACS) for 2007, 2008 and 2009. The ACS is conducted by the Census Bureau, and the microdata released for public use include records for about 1 million households, or about 3 million people.7
The economic analysis focuses on income and poverty. Unless otherwise mentioned, estimates of household income are adjusted for differences in the size of multi-generational and other households and are scaled to a uniform household size of three. Poverty rates are computed for people, not just heads of households. Generally speaking, most members of a household are assigned the same poverty status.8
The report also provides estimates of a generation’s and a person’s share of household income. Do young adults living with their parents or older parents living with their middle-age children account for a significant share of household income? What are the financial burdens on unemployed workers who live in multi-generational households compared with other households? In general, the report finds that the heads of multi-generational households account for a lower share of household income than do heads of other households, suggesting there is less of a burden on them to support the entire household. However, the report does not attempt to identify whether individual members of multi-generational households would be better or worse off living apart.
Other key findings of the report include:
Demographics of multi-generational households
- The number of Americans living in multi-generational households increased 4.9 million from 2007 to 2009. By contrast, the number of people in other households rose by only 333,000.
- The number of young adults (ages 25 to 34) in multi-generational households increased to 8.7 million in 2009 from 7.4 million in 2007. Both the numerical growth (1.3 million people) and the percentage increase it represents (16.8%) were larger than for any other age group.
- More than one-in-five (21.1%) young adults (ages 25 to 34) lived in multi-generational households in 2009.
- Among the major racial and ethnic groups, the sharpest growth in the multi-generational household population from 2007 to 2009 was among Hispanics (17.6%). The black population in these households grew by 8.7%, the white population by 8.5% and the Asian population by 7.3%.
- The most likely groups to live in multi-generational households are Asians (25.8% in 2009), blacks (23.7%) and Hispanics (23.4%). The share among whites was much lower (13.1%).
- In 2009, 16.2% of foreign-born heads of household and 9.6% of native-born heads of household lived in multi-generational households.
Household income and poverty rates
- After adjusting to a household size of three, the median income for multi-generational households was $57,533 in 2009, or 2% less than the $59,002 median income for other households.
- Among Hispanics, the adjusted median income of multi-generational households was $46,049 in 2009, compared with $38,710 for other households. Black multi-generational households also had higher incomes—$43,677 vs. $39,484. For Asian households the income difference is modest, and for whites it is nonexistent.
- In 2009, the median income of multi-generational households with foreign-born heads was 20% higher than for other households with foreign-born heads, $55,045 vs. $45,782.
- The poverty rate among young adults (ages 25 to 34) who lived in multi-generational households in 2009 was 8.7%, compared with 15.8% for these young adults in other households.
- In 2009, the poverty rate for Hispanics was 16.0% in multi-generational households and 25.5% otherwise. Among blacks, the poverty rate was 19.2% for those in multi-generational households and 27.3% elsewhere. For other groups, the differences in poverty across household types were more modest.
Income sharing in multi-generational households
Types of Households
One-generation households
Households that consist of only one generation; for example, a married or cohabiting couple, a single person, siblings or roommates. These households can be made up of families or non-families.
Two-generation households
Households that include a parent or parents and their child or children under age 25 (including stepchildren).
Multi-generational households
Multi-generational households include households with:
• Two generations: parents (or in-laws) and adult children ages 25 and older (or children-in-law); either generation can “head” the household
• Three generations: parents (or in-laws), adult children (or children-in-law), grandchildren
• “Skipped” generations: grandparents and grandchildren, without parents
• More than three generations
The definition of a multi-generational household used in this report is more expansive than the definition used by the Census Bureau. For more details, see Appendix A.
- A household head typically accounts for about half (48.8% in 2009) of income in a multi-generational household. Heads of other households typically account for 85.7% of household income.
- In 2009, the median share of household income from a child 25 or older living with a parent head of household (with no other generation present) was 24.7%. Older parents, when they lived with their child who is the householder, accounted for virtually the same amount, 24.8%.
- In 2009, employed heads of multi-generational households typically accounted for 54.1% of household income. The share drops by a third among unemployed householders, to 35.3%. In other households, household heads account for about the same share of household income regardless of employment status—83.2% if employed and 80.8% if unemployed.
About the Data
Data used in the report principally come from the U.S. Census Bureau’s American Community Surveys (ACS) in 2007, 2008 and 2009, provided by the Integrated Public-Use Microdata Series (IPUMS). The trends on Americans’ living arrangements come from Decennial Census data from 1900 to 2000 also provided by IPUMS. See Appendix A for more detailed information.
Terminology
The racial and ethnic identity of a household is determined on the basis of the racial and ethnic identity of the head of the household.
References to whites, blacks and Asians are to the non-Hispanic components of those populations.
“Asian” refers to persons reporting their racial origin as Asian alone as well as native Hawaiians and other Pacific Islanders. “Black” refers to black alone, and “white” refers to white alone.
“Foreign born” refers to persons born outside of the United States, Puerto Rico or other U.S. territories to parents neither of whom was a U.S. citizen.
“Native born” or “U.S. born” refers to persons who are U.S. citizens at birth, including those born in the United States, Puerto Rico or other U.S. territories and those born abroad to parents at least one of whom was a U.S. citizen.
Unless otherwise stated, all income estimates in this report are standardized to a household size of three and expressed in 2009 dollars.
About the Report
This report was researched and written by Rakesh Kochhar, senior researcher, and D’Vera Cohn, senior writer, of the Social and Demographic Trends project of the Pew Research Center. The datasets for the analysis were prepared by Jeffrey S. Passel, senior demographer at the Center. The report was edited by Paul Taylor, executive vice president of the Pew Research Center and director of the Social and Demographic Trends project. Research assistants Seth Motel and Eileen Patten and Gabriel Velasco, research analyst, assisted with charts and numbers-checking. The report was copy-edited by Marcia Kramer.
