Today’s military is smaller, older, more diverse and more likely to be married than the force that served a generation or two ago. A larger proportion of minorities and women serve as officers and enlisted personnel. Proportionately fewer high school dropouts and more college graduates fill the enlisted ranks. Since the military draft was abolished in 1973, more of America’s fighting forces are husbands or wives—and a growing proportion is married to someone else who serves in the military.26
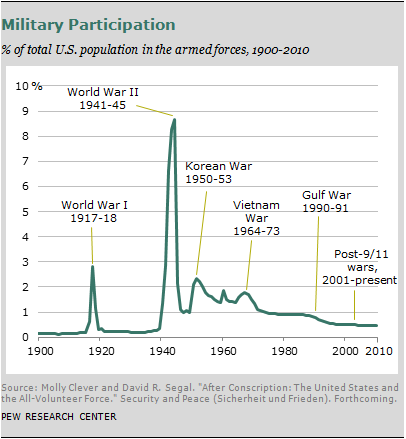
At the same time, America’s wars are being fought by a dwindling share of its population. The 9/11 attacks ushered in the longest period of sustained conflict in the nation’s history. Yet during this period the military participation rate fell below 0.5%. Not since the peacetime years between World War I and World War II has a smaller share of Americans served in the armed forces.
With the ranks of the modern military so small by historic standards, members of the National Guard and Reserves have been called upon to play an increasing role in the post-9/11 conflicts. And deployments for all forces—regular duty, National Guard and reservists—have become frequent and of longer duration.
If today’s military is different, so, too, are some of the key battlefield experiences. For example, advances in emergency medicine and quick access to state-of-the-art medical facilities have dramatically increased the chances that a soldier will survive a battlefield wound.
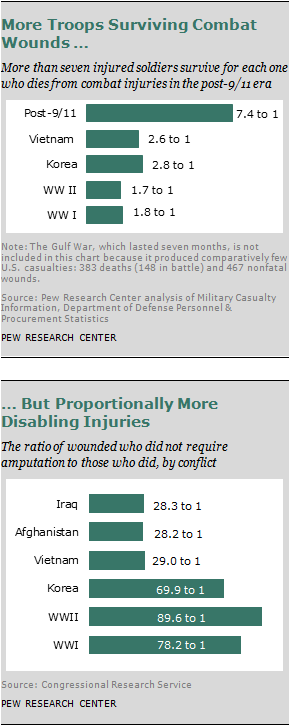
The “wounded-to-killed ratio,” which compares the number of service members wounded in action to the number who died, currently stands at 7.4 to 1 for the post-9/11 conflicts in Iraq and Afghanistan.
In Vietnam the wounded-to-killed ratio was 2.6 to 1, and in World War II the ratio was 1.7 to 1.
Expressed in a different way, troops fighting in Iraq and Afghanistan survive nearly 90% of all combat injuries, compared with 72% in Vietnam and 63% in World War II.
However, these medical miracles go only so far. Wounds that are not fatal can often be disabling. The ratio of wounded but not amputated-to-amputations in post-9/11 combat is virtually unchanged from Vietnam. Significantly fewer wounded soldiers underwent amputations in World War II because more died of their battlefield injuries, according to researchers Anne Leland and Mari-Jana Oboroceanu of the Congressional Research Service in a 2010 report to Congress.27
Citing data from the Office of the Surgeon General, Leland and Oboroceanu reported that the ratio of amputations-to-wounded stood at 28.3 to 1 in Iraq and Afghanistan. That means that for every 29 service members wounded in combat, one required amputation. In Vietnam, that ratio was slightly higher (29.0 to 1), while in World War II, it stood at 69.9 to 1.
Not all of the wounds suffered by members of the armed forces are physical. A significant minority of veterans and those who are currently serving report frequent nightmares, recurring flashbacks to emotionally disturbing incidents, outbursts of uncontrolled or inappropriate anger, and other symptoms of post-traumatic stress.
While comparative data are difficult to obtain, a 2008 study by the RAND Corp. found that 13.8% of those who had served in Iraq or Afghanistan suffered from PTS. That compares with 10.1% among those who served in the 1991 Gulf War and, depending on the study, about two to four times the estimated rate of PTS in the population as a whole.
One large-sample government study of Vietnam veterans in the mid-1980s found that 15.2% of all men and 8.1% of women who had served in Vietnam were diagnosed with PTS at the time the study was conducted. (See Chapter 4 for a detailed analysis of veterans’ experiences with PTS and other emotional issues.)
Whether or not they came home with battle scars, many young veterans have had a difficult return to civilian life for other reasons. In the wake of the Great Recession, the unemployment rate in 2010 for veterans who served since 9/11 stood at 11.5%, about two percentage points higher than the jobless rate for the country as a whole at the same time.
The sour economy has hit young people particularly hard, and veterans of the post-9/11 era have not been spared. More than one-in-five male veterans ages 18 to 24 were unemployed (21.9%) in 2010, not statistically different than the rate among similarly aged non-veterans (19.7%).
4 Million Have Served in the Post-9/11 Period
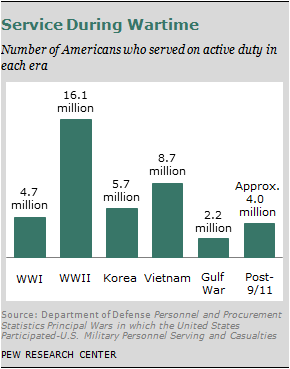
Approximately 4 million men and women have served in the active-duty military at some point in the 10 years since 9/11, and thousands more join their ranks each month. By comparison, about twice as many (8.7 million) were in the armed forces during the nine years of the Vietnam War (1964 to 1973).
Even though U.S. involvement in World War II lasted for less than four years (1941-45), a total of 16.1 million Americans served in that conflict. At the height of the war in 1945, nearly 9 percent of the population was in the military.
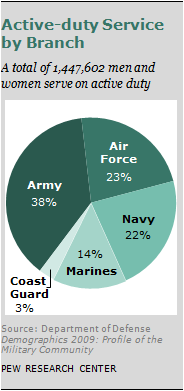
Today’s military is roughly 30% smaller than it was 20 years ago, when slightly more than 2 million men and women served on active duty. Currently a total of 1,447,602 men and women serve on active duty in the Army, Navy, Air Force, Marines or Coast Guard.
The military downsized in the aftermath of the Gulf War in 1991 and the end of the Cold War in the late 1980s. By 2000, the size of the active-duty force had fallen to just about
1.4 million. The 9/11 terrorist attacks and the conflicts in Afghanistan and Iraq halted the decline, and since 2000 the overall size of the military has increased by about 40,000.
The Army is the largest branch of the service. Nearly 550,000 men and women serve in the Army, or 38% of all those on active duty. Roughly 325,000 each are in the Air Force and Navy and slightly more than 200,000 are Marines. An additional 42,000 serve in the Coast Guard.
Since 9/11, the Army and Marines have added personnel while the Navy and Air Force have remained below pre-9/11 levels. In the past decade the size of the Army active-duty force has increased by roughly 70,000, with most of the growth (approximately 60,000) occurring in the past five years. The Marines have added about 30,000 to their ranks since 9/11. At the same time, the Air Force and Navy active-duty force each shrank between 20,000 and 45,000.
Reserves
Supplementing the regular active-duty force and often fighting alongside them in Iraq and Afghanistan are America’s “citizen-soldiers”: the National Guard and Reserves.
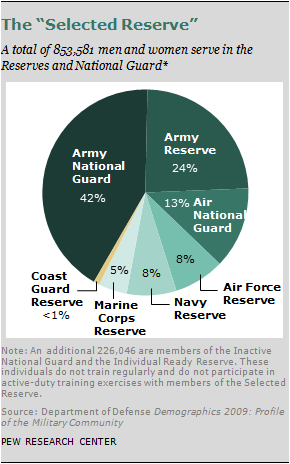
An additional 853,581 are members of the Selected Reserve, which is composed of the National Guard and Reserves and is available to be called to active duty. These forces drill regularly and participate in active-duty training exercises. An additional 226,046 in the Inactive National Guard and Individual Ready Reserve do not engage in regular training or active-duty drills.
The Army National Guard and Army Reserve make up two-thirds of the Selected Reserve. An additional 21% are members of the Air National Guard or Air Force Reserve. While estimates vary, more than seven-in-ten currently serving Selected Reserve personnel have been called to serve on active duty in the regular armed forces.28 In recent years, these active-duty tours frequently have come between call-ups by the governors of their home states to deal with local emergencies such as hurricanes, floods or wildfires, the traditional role of the National Guard.
A Snapshot of Today’s Military
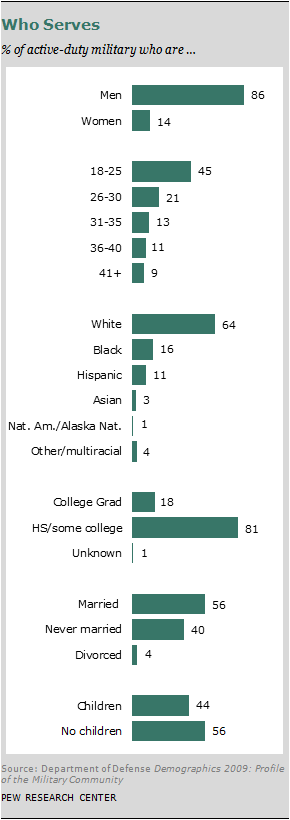
At first glance today’s armed forces resembles the military of a generation or two ago. Men outnumber women nearly 6-to-1. About two-thirds of those who serve are 30 years old or younger. Whites still comprise the bulk of America’s fighting forces. About eight-in-ten active-duty military personnel have less than a college degree. A majority (56%) are married, and a majority do not have children (56%).
But some of the same demographic changes that have reordered society as a whole in recent decades have also reshaped today’s armed forces. Since the draft was abolished in 1973, a growing share of the military is composed of women, minorities, high school and college graduates, parents, and married men and women.
The remainder of this chapter will examine some of the key demographic changes that are reshaping today’s armed forces.
An Older Military, Serving Longer
Young people still fight America’s wars. In 2009, slightly less than half of all active-duty military personnel were younger than 26 (45%) while about two-thirds were 30 or younger. Only about one-in-ten military personnel are older than 40.
However, the military has been getting older since the draft ended in 1973. In 2009 the age of the average enlisted personnel was slightly more than 27, up from 25 years old in 1973. Similarly, the average age of officers has increased from 32 to slightly less than 35 years.
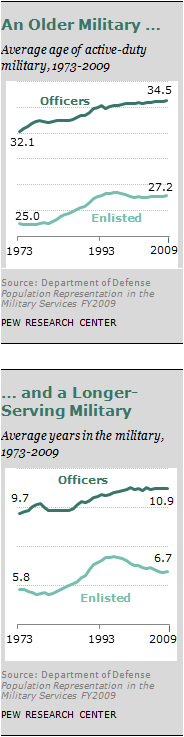
Despite these changes, the age gap between officers and the troops they lead has remained largely unchanged. In 1973, the average officer was 7.1 years older than the average enlisted man or woman; in 2009, the gap stood at 7.3 years.
Today’s military also is serving somewhat longer than its counterparts a generation or two ago. The average officer in 2009 had been in the military nearly 11 years, slightly more than a year longer than the average in 1973.
The pattern among enlisted personnel is more complicated. The average length of service for enlisted personnel rose from 5.8 years in 1973 to a peak of 7.5 in 1994 and 1996, but then began drifting downward and now stands at 6.7 years.
More Women Serving
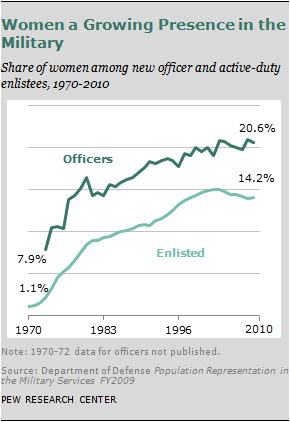
Women comprise an increasing share of all active-duty officers and enlisted personnel. Overall, about one-in-seven active-duty military personnel are women (14.3%), up from about 11% in 1990 but down slightly from a high of 14.7% in 2000.
In 2009, nearly 21% of new officers and 14% of newly enlisted personnel were female. Women comprised 15.5% of all officers in 2009, compared with 11.5% in 1990. The share of women enlisted members also rose, from 10.9% in 1990 to 14.1% in 2009.
The share of women in the ranks varies significantly by service branch. Women comprise nearly one-in-five officers and enlisted members in the Air Force (19.5%) but only 6.4% of all Marines.
Women make up 15.4% of the Navy and 13.4% of the Army.
Women comprise a slightly larger share of the National Guard and Reserves. In 2009, about 17.8% of all Selected Reserve personnel were female: 17.8% enlisted personnel and 18.1% of all Guard and Reserve officers.
A quarter of all Air Force reservists (25%) were women, compared with 14% of the Army National Guard, 23.7% of the Army Reserve, 19.8% of the Navy Reserve, 18.5% of the Air National Guard and 4.9% of all Marine Corps reservists.
Women represent a much smaller proportion of the military relative to their share in the civilian workforce. More than half (54.4%) of the U.S. civilian work force 16 years old and older was female in 2009, nearly four times the share of women in the military
Minorities a Growing Share of Military
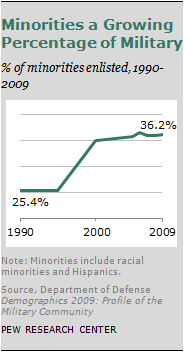
The percentage of racial minorities in the ranks of officers and enlisted personnel has increased significantly since 1990. In 2009, more than a third of all active-duty personnel were minorities (36.2%), an increase from 25.4% about two decades ago.
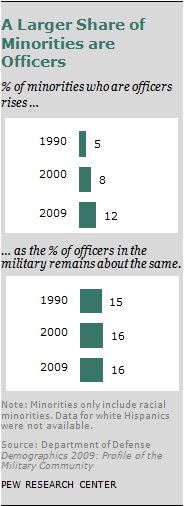
The proportion of racial minorities who are serving in the officer corps has more than doubled in the past two decades. In 1990, minorities were underrepresented in the officer corps: Only about 5% of all minorities were officers, even though officers constituted about 15% of all active-duty personnel. Currently 12% of all minorities serve as officers—double the proportion in 1990—while officers make up about 16% of the active-duty force.
Whites, including white Hispanics, make up 70.3% of the military. About 17% of all active-duty personnel report that they are black. Asians constitute 3.6% of the active-duty force. Smaller shares say they are Native Americans or Alaska natives (1.7%), or Native Hawaiian or Pacific Islanders (0.6%). An additional 5.2% of the military say they are a member of another racial group or do not specify their race and 1.6% report they are “multiracial.”
Analyzing recent trends in minority service is complicated. Beginning in 2009, to conform to the latest Office of Management and Budget directives, the Department of Defense no longer considers Hispanics to be a minority designation. Instead, minority status is based only on an individual’s race, which means white Latinos are no longer considered minorities for purposes of data collection and reporting. Instead, Latinos of any race are analyzed separately as an ethnic minority group.
More than one-in-ten (10.7%) of active-duty personnel in 2009 reported they were of Hispanic ethnicity, with white Hispanics making up about six-in-ten of all Latinos on active-duty service.
As a result of this change in definition, the Department of Defense reported in its Fiscal Year 2009 Demographic Profile that the share of minorities in the military declined from 36.0% in 2008 to 29.7% in 2009. When Latinos are included in the calculation, the percentage of racial and ethnic minorities on active-duty service increased slightly to 36.2% in 2009.
Whites make up a slightly larger share of the Selected Reserve. About three-quarters of all reservists and National Guard personnel are white (76.0%), compared with 70.3% of the active-duty force. At the same time, blacks comprise a slightly smaller share of all Guard and Reserves (14.9% of the Selected Reserves vs. 17.0% for the active-duty force). Similar to the pattern among active-duty personnel, minorities now comprise a larger share of the Selected Reserve than they did in 1990 (30.4% vs. 25.6%).
Marital Status
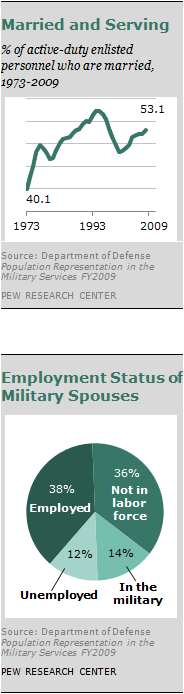
The growing presence of married men and women in the enlisted ranks is among the more striking changes in the military since the end of the draft in 1973.
Today, a majority of all enlisted personnel are married (53.1%). In 1973 married men and women comprised only about four-in-ten active-duty enlisted personnel (40.1%). Married personnel were an even larger share of the enlisted force in 1995, when they constituted 57.3% of the armed forces.
These trends are in direct contrast with changes in marriage rates in the broader society. In 1960, 72% of all U.S. adults ages 18 and older were married; by 2008, that share had fallen to 52%.29
Officers are older than enlisted personnel and, predictably, a significantly larger share (70.1%) of officers are married. Overall, those in the military are significantly more likely to be married than are civilians of a comparable age (55.8% vs. 47.7% of all adults younger than 45).30
Marriage rates differ significantly between the Marines and the other three large branches of the military. In 2009, majorities of Air Force (59.3%), Army (58.0%) and Navy (54.2%) personnel were married, compared with less than half of all Marines (46.9%).
About 7% of all military personnel are married to someone else in the service. About 12% of all Air Force active-duty personnel are married to another service member—nearly triple the percentage of Marines (4.0%) and more than double the proportion in the Navy (5.4%) and Army (5.1%).
Expressed a slightly different way, about one-in-seven (14%) of all husbands and wives in the military are married to someone else in the service. About four-in-ten military spouses (38%) are employed outside the armed forces, while 12% are unemployed and looking for work. The remainder—36%—are not in the labor force, a group composed of stay-at-home mothers, individuals caring for a sick or disabled family member, those who are physically unable to work and retirees.
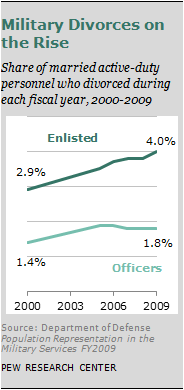
Divorce Rate Increases since 9/11
While divorce has become less common in recent years among all adults, the divorce rate among all military personnel has grown. The overall divorce rate (share of marriages that end in divorce in a given year) among all married officers and enlisted personnel stood at 3.6% in 2009, or virtually identical to the percentage among similarly aged adults in the civilian population.
However, the divorce rate among enlisted personnel is more than double the rate among officers (4.0% vs. 1.8%). The enlisted divorce rate also is growing faster than the rate among officers, increasing from 2.9% in 2000 to 4.0% in 2009. The share of divorces among married officers increased from 1.4% in 2000 to 1.8% in 2009.
About half (48.5%) of all members of the National Guard and Reserves components of the Selected Reserve are married, while 44.0% are single and 7.2% are divorced. In the past nine years, the proportion of Reservists and Guard personnel who are married has declined nearly 5 percentage points while the proportion of active-duty members who are married has increased by about 3 percentage points.
More Parents
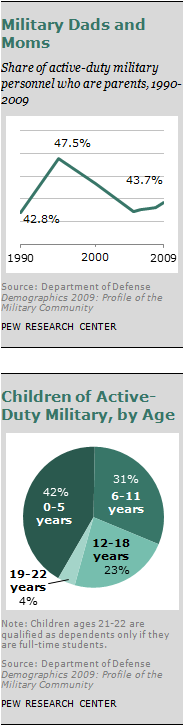
More than four-in-ten active-duty military personnel are fathers or mothers (43.7%), up slightly from 1990 but a decline from 1995, when nearly half (47.5%) were parents. About four-in-ten active-duty military personnel are married with children (38.4%), and 5.3% are single parents.
The military does not report detailed breakdowns of all children of active-duty military personnel. However, the Department of Defense does monitor the number of dependent children claimed by service members. In order to qualify as a dependent, the child must be 20 or younger, or be 21 to 22 and enrolled as a full-time student. Children older than 22 cannot be claimed as dependents.
More than half of all dependent children (53.4%) are younger than eight years old. Four-in-ten (42.0%) are five or younger. Only about 4% of all dependents are 19 to 22 years old.
Education Levels
About eight-in-ten active-duty military personnel are high school graduates or have completed at least a year of college or other postsecondary training. Nearly two-in-ten (17.9%) are college graduates or have an advanced degree, while only 0.6% never finished high school.
Officers are far better educated than the typical enlisted man or woman. More than eight-in-ten officers are college graduates (51.3%) or have an advanced degree (34.7%), while 9.3% have less than a bachelor’s degree. (In comparison, only 29.5% of the population aged 25 or older has a college or advanced degree in 2009, according to Census Bureau data.)
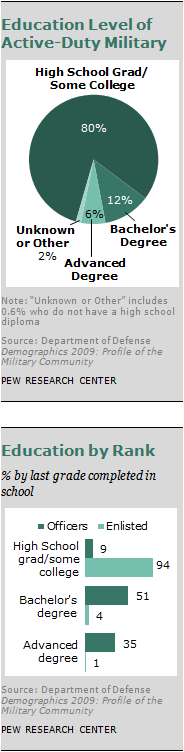
Relatively few enlisted men and women are college graduates (4.1%) or have an advanced degree (0.5%). More than nine-in-ten (94.0%) are high school graduates and some of them have attended some college. Taken together, more than 98% of the enlisted force has at least a high school diploma, compared with 86.7% of the U.S. civilian population aged 25 or older.
Today’s active-duty enlistees are slightly more likely to be college graduates than someone in their service cohort a generation or two ago. In 2009, about 4.6% of all enlisted personnel were college graduates, compared with 2.5% in 1990. At the same time, the proportion who had no high school diploma or GED fell from 1.8% to 0.7%.
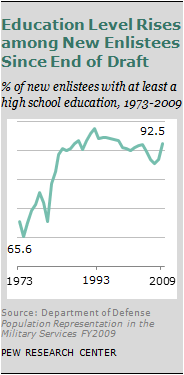
This recent change follows a dramatic increase in education levels of enlistees that occurred after the draft ended. Until 1982, the average recruit was less well educated than the typical 18- to 24-year-old. For example, in 1977, the first year for which comparable data are available, 71.5% of all recruits had at least a high school diploma, compared with 79.1% of their civilian age cohorts. But education levels quickly rose, and by 2009, 92.5% of recruits were at least high school graduates, compared with 82.8% of comparably aged civilians.
In contrast to the pattern among enlisted personnel, education levels of officers have declined slightly over the past 19 years. In 1990, nearly nine-in-ten officers (89.6%) had a college diploma or an advanced degree, compared with 86.0% of today’s officer corps. At the same time, the proportion of officers with less than a bachelor’s degree nearly doubled, from 4.7% to 9.3%.
Proportionally more of those who serve in the Air Force are college graduates (24%) than those in the Army (18%), Navy (16%) or Marines (10%).
A substantial majority (77%) of those in the National Guard or Reserves are at least high school graduates but have less than a bachelor’s degree. That is somewhat smaller than the proportion of active-duty military personnel with similar educational credentials (77% vs. 80%).


