Households headed by older adults have made dramatic gains relative to those headed by younger adults in their economic well-being over the past quarter of a century, according to a new Pew Research Center analysis of a wide array of government data.
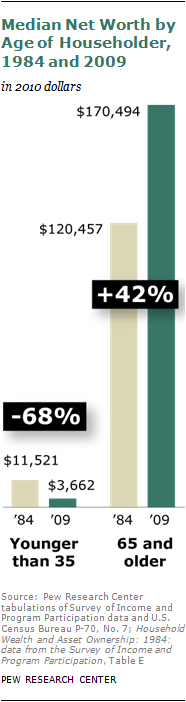
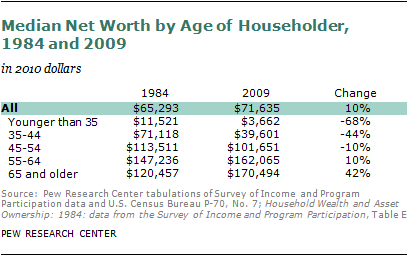
In 2009, households headed by adults ages 65 and older possessed 42% more median1 net worth (assets minus debt) than households headed by their same-aged counterparts had in 1984. During this same period, the wealth of households headed by younger adults moved in the opposite direction. In 2009, households headed by adults younger than 35 had 68% less wealth than households of their same-aged counterparts had in 1984.
As a result of these divergent trends, in 2009 the typical household headed by someone in the older age group had 47 times as much net wealth as the typical household headed by someone in the younger age group–$170,494 versus $3,662 (all figures expressed in 2010 dollars). Back in 1984, this had been a less lopsided ten-to-one ratio. In absolute terms, the oldest households in 1984 had median net wealth $108,936 higher than that of the youngest households. In 2009, the gap had widened to $166,832.
Housing has been the main driver of these divergent wealth trends. Rising home equity has been the linchpin of the higher wealth of older households in 2009 compared with their counterparts in 1984. Declining home equity has been one factor in the lower wealth held by young households in 2009 compared with their counterparts in 1984.
Trends over the same period in other key measures of economic well-being—including annual income, poverty, homeownership, and home equity—all follow a similar pattern of older adult households making larger gains, compared with households headed by their same-aged counterparts in earlier decades, than younger adult households, according to the Pew Research analysis.
These age-based divergences of households widened substantially with the housing market collapse of 2006, the Great Recession of 2007-2009 and the ensuing jobless recovery. But they all began appearing decades earlier, suggesting they are as much linked to long-term demographic and social changes as they are to the sour economy of recent years.
For the young, these long-term changes include delayed entry into the labor market and delays in marriage—two markers of adulthood traditionally linked to income growth and wealth accumulation.2 Today’s young adults also start out in life more burdened by college loans than their same-aged peers were in past decades, as documented in a recent Pew Research report.3 At the same time, growing numbers are in college, and college education has been found to confer a significant financial payoff over the course of a lifetime.4
Another change is that, compared with young adults in the past, today’s young adults are more likely to be minorities and more likely to be single parents. These characteristics have been linked with lower economic well-being. However, more young women are working than used to be the case, and many young women are postponing childbearing, with its associated costs.
Economic Well-being over Time
The report does not track the well-being of the same set of households as they age over time. Thus, the analysis does not shed light on the economic mobility or progress of any particular group of households as their heads of household aged.
The major findings of this report provide estimates of the wealth of U.S. households in 1984, 2005 and 2009 and income of U.S. households in 1967 to 2010. Households are grouped by the age of the head of the household in the survey year. The wealth of households headed, for example, by adults younger than 35 in 2009 (born in 1975 or later) are then compared with the wealth and income of households headed by adults younger than 35 in 1984 (born in 1950 or later). Similarly, the wealth and income of households headed by adults 65 and older in 2009 (born in 1944 or earlier) are compared with the wealth and income of households headed by adults 65 and older in 1984 (born in 1919 or earlier). The composition of the households being compared over time may differ on other demographic characteristics of the household head, such as race, ethnicity, nativity and education level.
For older Americans, one key change over the past quarter century has been an increase in the share who are employed. The share of adults ages 65 and older who are employed reached an historic low of 10% in 1985 but has since risen to 16% in 2010. Meantime, older adults continue to have the advantage of inflation-indexed Social Security as the anchor of their annual income streams. Today, as in 1984, on average Social Security accounts for 55% of the annual income of households headed by adults ages 65 and older.
Older Americans also have been the beneficiaries of good timing, in the form of the long run-up in home values that enabled them to accumulate wealth via home equity. Most of today’s older homeowners got into the housing market long ago, at “pre-bubble” prices—half purchased their present homes before 1986, according to the 2009 American Housing Survey.5 Along with everyone else, they’ve been hurt by the housing market collapse of recent years, but over the long haul, most have seen their home equity rise. Moreover, most older homeowners (65%) do not have a mortgage to pay.
For young adults who are in the beginning stages of wealth accumulation, there has been no such luck, at least so far. Among those who are homeowners, many bought as the bubble was inflating. When the bubble burst, many were left with negative equity in their homes.
Wealth Trends
Household wealth is the sum of all assets (house, car, savings account, 401(k) account, etc.) minus the sum of all debts (home mortgages, car loan, student loan, credit card debt, etc.) of everyone living in the household. People typically accumulate wealth as they age, so large age-based disparities on this measure are to be expected. However, the current gap is the largest in the 25 years that the government has been collecting this data.
The widening of the age-based wealth gap hinges mainly on housing, which is the cornerstone of most households’ wealth.
Compared with their same-aged counterparts a quarter-century ago, today’s households headed by adults ages 65 and older are more likely to own a home (79% in 2009 versus 73% in 1984). Overall, older households had 57% more median equity in their homes in 2009 than did households headed by older adults in 1984. Home equity represented a larger share of mean total wealth for older households in 2009 (44%) than for older households in 1984 (39%).
By contrast, households headed by adults younger than 35 had less housing wealth in 2009 than did households headed by younger adults in 1984. These household heads are slightly less likely to be homeowners (38% in 2009 versus 40% in 1984), and home equity plays a smaller role in their overall wealth (31% in 2009 versus 46% in 1984).
The importance of home equity in pushing up the net worth of older American households can be demonstrated by analyzing trends for net worth other than home equity. If it had not been for home equity, the median net worth of older American households in 2009 would have been 33% lower than that of older households in 1984, instead of 42% higher. For young households, there is no such difference: Median net worth in 2009 would be 66% lower than their counterparts in 1984 if home equity is excluded, compared with 68% lower if equity is included.
Income Trends
On another measure of economic well-being—household income—the numbers are less dramatic, but the pattern shows older households again doing better than younger ones, relative to comparable households in earlier years.
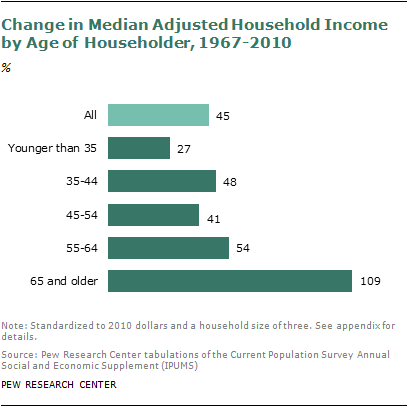
Households in all age groups have made gains compared with their predecessors over the course of many decades, but the incomes of the oldest households have risen four times as sharply as those of the youngest ones. As a result, incomes of the oldest households, which have been lower than those of younger households, are catching up.
In households headed by adults younger than 35, the median adjusted annual income in 1967 was $38,555, compared with $49,145 in 2010, an increase of 27% (all figures are expressed in 2010 dollars and standardized to a household size of three). By contrast, in households headed by adults ages 65 and older, the median adjusted annual income in 1967 was $20,804, compared with $43,401 in 2010, an increase of 109%.
The sources of income for households headed by adults ages 65 and older include a steady share of total income, about 55%, from Social Security over the past three decades. Older households also have a rising share of income from wages and salaries, while households headed by young adults have lower shares from wages and salaries, compared with similar households a decade ago.
Poverty
Median income is a measure of what is happening in the middle of the population. Poverty statistics reflect what is happening at the bottom, and they tell a familiar story of changes in economic status for young and old.
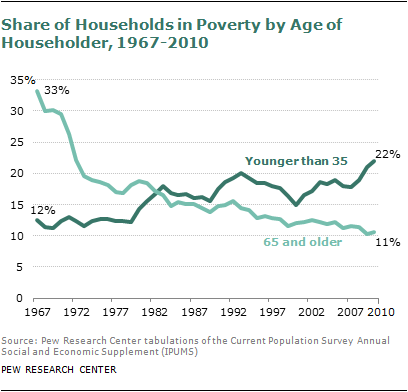
Among households headed by adults younger than 35, the share with income below the poverty line has jumped since 1967. Among households headed by adults ages 65 and older, the share living below the poverty line declined.
In 2010 11% of households headed by adults ages 65 and older were in poverty, compared with 33% in 1967.
Poverty rates for households headed by adults younger than 35, meanwhile, began climbing in the 1980s and today are nearly 10 percentage points higher than what they were in 1967. Among households headed by an adult younger than 35, 22% were in poverty in 2010, compared with 12% in 1967.
The Great Recession
Although the economic well-being gap between young and old has been widening for decades, the economic turbulence of recent years has accelerated these trends.
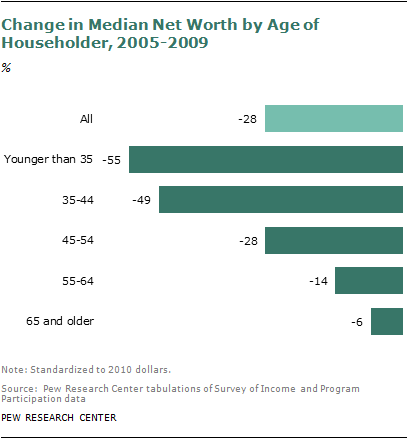
Looking at changes from 2005 to 2009, all households had lower median net worth. But the decline for households headed by younger adults was much steeper.
For households headed by adults ages 65 and older, median net worth in 2009 was 6% below that of the oldest households in 2005. For households headed by adults younger than 35, median net worth was 55% less than that of the youngest households in 2005. (Of course, the 2005 wealth base of young households was so small that even a small decline would have a large percentage impact.) Another notable change for younger households during this period is that the share with negative or no net worth rose from 30% in 2005 to 37% in 2009.
The same pattern holds for household income, for which data are available through 2010. In 2010, the adjusted median income of the oldest households was 8% greater than that of the oldest households in 2005. For the youngest households, however, adjusted median income was 4% less than it had been for the youngest households in 2005.
About this Report
The report describes trends over time for households headed by different age groups in wealth, housing, income and other measures of economic well-being. The two main data sources for this report are both from the U.S. Census Bureau.
The wealth data, including homeownership trends, are drawn from the Survey of Income and Program Participation (SIPP), a panel survey that began in 1984 and for which the most recently published data are from 2009. The report includes some comparisons from 2005 to 2009, a period that approximately reflects the impact of the Great Recession. The national economic downturn, according to the National Bureau of Economic Research, ran from December 2007 to June 2009. SIPP has periodically collected wealth data since 1984 and is considered an authoritative source on the wealth of American households. As with any survey, SIPP estimates are subject to sampling and nonsampling errors.
The income and poverty data for 1967-2010 (reflecting responses from survey years 1968-2011) are drawn from the Annual Social and Economic Supplements to the Census Bureau’s Current Population Survey.
Dollar amounts are adjusted for inflation and reported in 2010 dollars.
Following convention, this report’s wealth figures are measured at the household level and do not reflect any adjustments for the size of the household.
The household income figures are adjusted for the size of the household, details of which are explained in the appendix.
The poverty measure is the official federal poverty measure, and as such takes into account not only the size of the household but also the nature of the family members (the number of children and age of the householder). Poverty is typically reported for individuals. Since most of the report focuses on the economic well-being of households, the report presents the poverty status of households based on the status of the household head. So, for example, the report shows the poverty rate of households headed by adults ages 65 and older, not the poverty rate of adults ages 65 and older.
The trends in wealth begin with 1984 simply because that is when the SIPP wealth data collection began. In terms of the business cycle, 1984 was a recovery year following the 1981-82 recession, while 2009 could be construed as a recession year because the recession officially ended in June 2009 according to the NBER business cycle dating committee. While recognizing that 1984 and 2009 are at different points in the business cycle, the trends observed in economic well-being across age groups are also apparent between 1984 and 2005 (two years that are more similar in terms of the business cycle).
See the appendix for additional details on data sources and methodology.
This report was conceived and researched by Richard Fry, senior economist with the Pew Research Center’s Social & Demographic Trends project. The report was written by D’Vera Cohn, senior writer; Gretchen Livingston, senior researcher; and Paul Taylor, executive vice president of the Pew Research Center and director of the Social & Demographic Trends project. Seth Motel, research assistant, produced the charts. The charts were number-checked by Eileen Patten, research assistant; she and Motel number-checked the text. The report was copy-edited by Marcia Kramer. Editorial guidance was provided by Rakesh Kochhar, senior researcher with the Pew Research Center.


