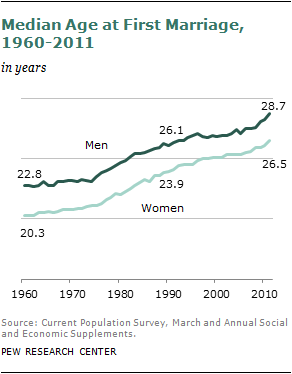
Barely half of all adults in the United States—a record low—are currently married, and the median age at first marriage has never been higher for brides (26.5 years) and grooms (28.7), according to a new Pew Research Center analysis of U.S. Census data.
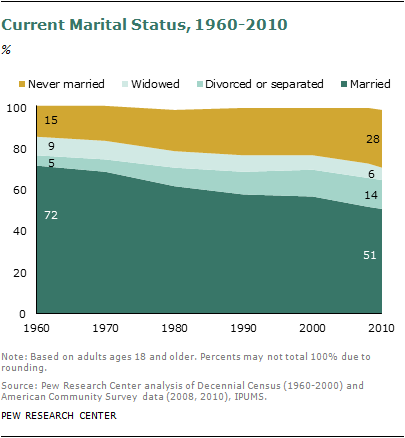
In 1960, 72% of all adults ages 18 and older were married; today just 51% are. If current trends continue, the share of adults who are currently married will drop to below half within a few years. Other adult living arrangements—including cohabitation, single-person households and single parenthood—have all grown more prevalent in recent decades.
The Pew Research analysis also finds that the number of new marriages in the U.S. declined by 5% between 2009 and 2010, a sharp one-year drop that may or may not be related to the sour economy.
The United States is by no means the only nation where marriage has been losing “market share” for the past half century. The same trend has taken hold in most other advanced post-industrial societies, and these long-term declines appear to be largely unrelated to the business cycle. The declines have persisted through good economic times and bad.
In the United States, the declines have occurred among all age groups, but are most dramatic among young adults. Today, just 20% of adults ages 18 to 29 are married, compared with 59% in 1960. Over the course of the past 50 years, the median age at first marriage has risen by about six years for both men and women.
It is not yet known whether today’s young adults are abandoning marriage or merely delaying it. Even at a time when barely half of the adult population is married, a much higher share— 72%—have been married at least once. However, this “ever married” share is down from 85% in 1960.
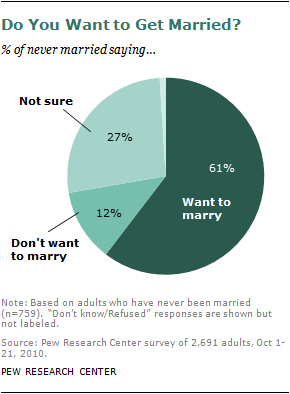
Public attitudes about the institution of marriage are mixed. Nearly four-in-ten Americans say marriage is becoming obsolete, according to a Pew Research survey in 2010.1 Yet the same survey found that most people who have never married (61%) would like to do so someday.
It is beyond the scope of this analysis to explain why marriage has declined, except to note that it has declined far less for adults with college educations than among the less educated. Some of the increase in the median age at first marriage over the long term can be explained by the rising share of young adults enrolled in college, who have tended to marry later in life; recently, there are indications that adults who are not college graduates also are marrying later.2 Fallout from the Great Recession may be a factor in the recent decrease in newlyweds, although the linkage between marriage rates and economic hard times is not entirely clear.3
Divorce is a factor in diminishing the share of adults who are currently married compared with 50 years ago. But divorce rates have leveled off in the past two decades after climbing through the 1960s and 1970s, so divorce plays less of a role than it used to.4
What is clear is that a similar delay and decline of marriage is occurring in other developed nations, especially those in Europe, and in some cases in less developed nations. According to a recent United Nations report that analyzed marriage trends in the context of their impact on fertility,5 female age at first marriage rose from the 1970s to the 2000s in 75 of 77 countries included in its analysis. The increase was most marked in developed nations—and especially notable in those countries because the age at first marriage had been declining until the 1970s.
[cohabiting]
Terminology
“Currently married” includes married adults ages 18 and older with spouse present or absent but not separated.
“Median age at first marriage” is a Census Bureau approximation derived indirectly from tabulations of marital status and age. See http://www.census.gov/population/www/cps/cpsdef.html (Marriage, Age at first.)
“Newly married” or “newlywed” is based on a question in the American Community Survey (ACS) asking respondents whether they got married in the past 12 months. The ACS is administered throughout the year, so the marriages could have taken place during the survey year or during the previous calendar year. In the 2010 ACS, for example, respondents could have been newly married as far back as January 2009 or as late as December 2010.
“New marriage rate” is computed using as the numerator the number of adults ages 18 and older who answered yes to the American Community Survey question asking whether they had married within the past 12 months. The denominator is the number of adults ages 18 and older who have never married, who are divorced or widowed, or who married within the past year.
Race/Ethnicity: References to whites, blacks and Asians are to the non-Hispanic components of those populations. Hispanics can be of any race. Asians also include Pacific Islanders.
About the Report
The demographic data in this report come from two Census Bureau surveys and the decennial censuses of 1960-2000. The Census Bureau’s analysis of Current Population Survey data is the basis for reporting trends in median age at first marriage. The American Community Surveys (ACS) of 2008, 2009 and 2010 are used to analyze the marital status of adults in those years and to analyze trends in new marriages. The decennial censuses of 1960-2000 are used to analyze the marital status of adults in those years.
[Machine-readable database]
This report was written by D’Vera Cohn, senior writer, and by Wendy Wang, research associate, who also produced the charts. It was researched by Wang; Jeffrey S. Passel, senior demographer; and Gretchen Livingston, senior researcher. The report and charts were number-checked by Eileen Patten, research assistant, and copy-edited by Molly Rohal, communications coordinator. Paul Taylor, executive vice president of the Pew Research Center and director of the Social & Demographic Trends project, as well as Kim Parker, associate director of the Social & Demographic Trends project, provided editorial guidance.
Newlywed Trends
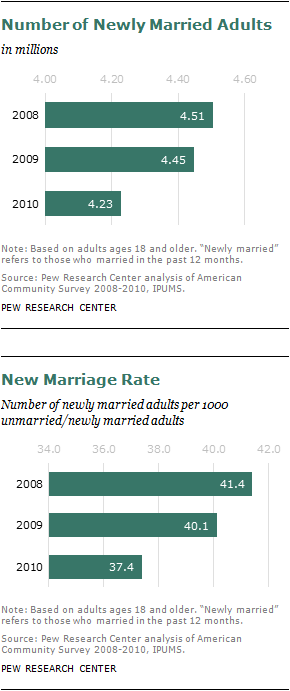
The decline in the number of newly married adults6—from 4.4 million in 2009 to 4.2 million in 2010—was shared among all age groups but was especially sharp for the youngest adults. Among adults ages 18-24, the number who recently married dropped 13% between 2009 and 2010, according to American Community Survey estimates (see appendix tables for details).
The decline in the number of newlywed men and women does not account for possible changes in population size or composition, but even when these factors are included, the trend does not change. For this analysis, the number of newlyweds was divided by the number of unmarried people and newlyweds in order to calculate a new-marriage rate.
In 2009, there were 40.1 newlyweds per thousand unmarried and newly married adults ages 18 and older. In 2010, that declined to 37.4, a 2.7 point drop. The number also declined from 2008 to 2009, though less sharply; there had been 41.4 newlyweds per thousand unmarried and newly married adults in 2008.7
The trends in newlywed numbers and rates varied somewhat among different age groups. The youngest adults had the biggest decline from 2009 to 2010, but numbers and rates also dropped for adults ages 25-34 and those ages 45 and older. The number rose and the rate was stable for adults ages 35-44.
Among the major racial and ethnic groups, the rates of new marriages—that is, number of newlyweds per thousand unmarried and newly married adults—declined for all groups. Even though the new marriage rate was highest for Asians, the drop was sharpest for this group. By education level, the decline was less sharp for college graduates than for less educated Americans.
The decline in new marriages shown in the American Community Survey is generally consistent with trends from the National Center for Health Statistics, which collects data from states on marriage licenses issued.8
Share Married
The share of Americans ages 18 and older who are currently married has been declining for many decades, reaching a record low 51% in 2010, based on analyses of Decennial Census and American Community Survey data. In 1960, 72% of adults were currently married and 15% were never married. The share of adults who were currently married dropped to 51%, and the never married group increased to 28% in 2010. The proportion divorced or separated, 14% in 2010, is higher than it was in 1960 but grew little over the past two decades. Widows and widowers made up the remaining 6% of adults in 2010.
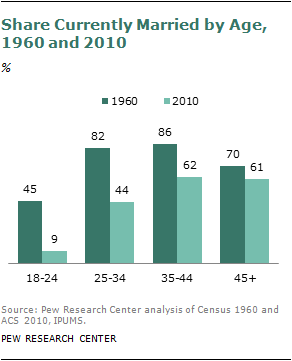
By age group, the decline in the proportion of currently married adults is most dramatic for the young. Only 9% of adults ages 18-24 were married in 2010, compared with 45% in 1960. Among adults ages 25-34, fewer than half (44%) were married in 2010, compared with 82% in 1960. Although most Americans in their mid-30s onward are married, the proportions have declined notably since 1960.
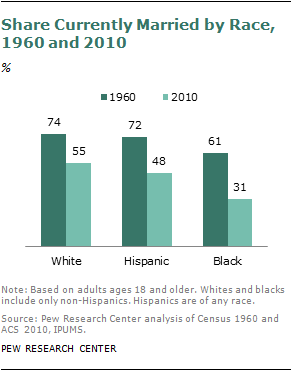
The proportions currently married by racial and ethnic group diverge notably. More than half (55%) of whites are married, a decline from 74% in 1960. Among Hispanics, 48% are married, compared with 72% in 1960. Among blacks, only 31% are married, compared with 61% in 1960. Some differences between the groups can be explained by the younger age structure of Hispanics and blacks, compared with whites.
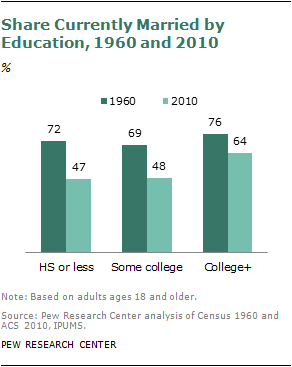
Adults also differ markedly in their likelihood to be married by educational attainment. Nearly two-thirds of adults with college degrees (64%) are married; just under half of those with some college education (48%) or a high school education or less (47%) are married. In 1960, the most educated and least educated adults were about equally likely to be married.
Age at First Marriage
The age at which Americans marry for the first time has been rising for decades. In the 1960s, most men and women married by their early 20s. In 2011, the median age at first marriage is in the late 20s and is the highest since at least 1890, the first year for which the Census Bureau has published statistics; other research indicates the median age peaked around 1900.9 In recent decades, the median age for men has been about two years higher than that for women.
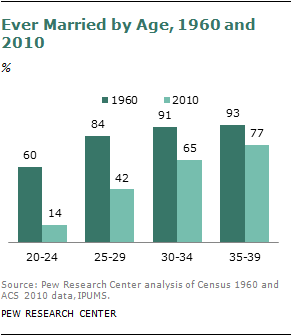
Clearly, the rising age of first marriage is an important factor in explaining the diminishing share of Americans who have ever married, which includes those whose marriages have ended. Among 20- to 24-year-olds, 60% had ever been married in 1960, when the median age at first marriage for men was 22.8 and for women was 20.3. In 2010, only 14% of this age group had ever been married, and the median age at first marriage had risen to the late 20s. Even among 25- to 29-year-olds, 84% of whom had ever been married in 1960, only 42% were in 2010.
By race and ethnic group, the share who had ever married was similar for whites, blacks and Hispanics in 1960, but the decline in marriage has been particularly severe for African Americans. In 2010, only 55% of black adults had ever married, compared with 64% of Hispanics and 76% of whites. Some of this difference can be explained by the older age structure of the white population.
By education level, the likelihood of having ever been married has declined for all groups, but most sharply for the least educated. Among adults without a high school diploma, 69% had ever been married in 2010, compared with 88% in 1960. Among adults with college degrees, 78% had ever been married in 2010, compared with 82% in 1960.
Public Attitudes
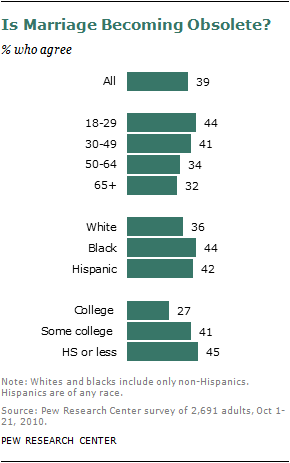
Public opinion about marriage echoes the declining prevalence of marriage. In a 2010 Pew Research Center survey, about four-in-ten Americans (39%) said they agree that marriage as an institution is becoming obsolete. Back in the 70s, only 28% agreed with that premise.10
Younger generations are more likely than those ages 50 and older to hold the view that marriage is becoming obsolete. Some 44% of blacks say marriage is becoming obsolete, compared with 36% of whites. Adults with college degrees (27%) are much less likely than those with a high school diploma or less (45%) to agree that marriage is becoming obsolete.
When analyzed by respondents’ marital status, these differences sharpen. Just 31% of married adults agree that marriage is becoming obsolete, compared with 46% of all unmarried adults, 58% of never married single parents and 62% of cohabiting (unmarried) parents.
However, attitudes toward the institution of marriage do not always match personal wishes about getting married. Asked whether they want to get married, 47% of unmarried adults who agree that marriage is becoming obsolete say that they would like to wed.
Among unmarried adults who disagree that marriage is becoming obsolete, virtually the same share (45%) says they want to marry. The two groups are similar in their shares of “don’t want to get married” (26% vs. 24%) or “not sure” (26% vs. 31%).
Previous marriage experience plays a big role in whether people want to get married (again) or not. A majority of adults who have never been married say that they want to get married (61%), compared with only 26% of adults who have ever been married but are currently unmarried.


