I. Overall Characteristics
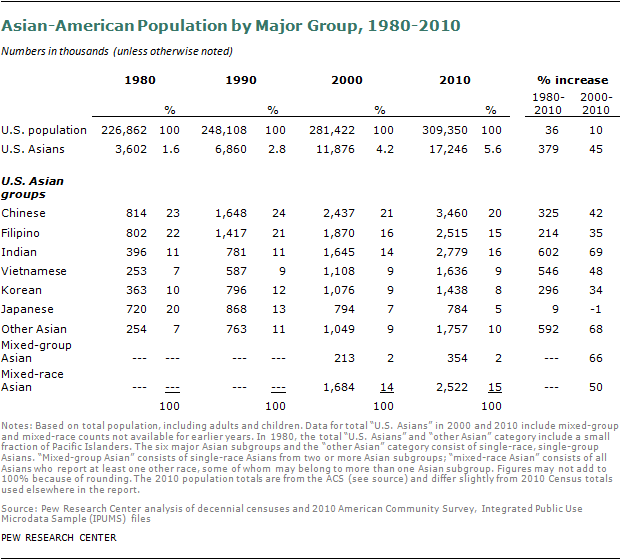
The 2010 Census counted more than 17 million Asian Americans, or 5.6% of the U.S. population (and 5.5% of U.S. adults ages 18 and older).14 The Asian-American population grew faster than any other race group from 2000 to 2010 (46%) and its numbers roughly quadrupled from 1980 to 2010.15
Included in this population are 2.6 million U.S. mixed-race residents who are Asian and at least one additional race, accounting for 15% of all Asian Americans. The share of Asians of more than one race is higher than the comparable share of whites (3%), blacks (7%) and Hispanics (6%).16 This mixed-race group, most of whom identify as Asian and white, grew by 60% from 2000 to 2010, even faster than the Asian-American population.
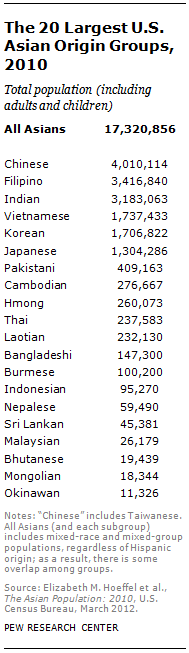
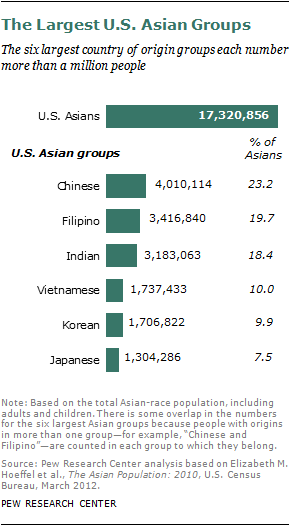
Asian Americans either are immigrants from Asia (59%) or are descendants of immigrants (41%). The vast majority of the Asian-American population (at least 83%)17 trace their roots to only six countries—China, India, Japan, Korea, the Philippines and Vietnam. As the accompanying chart shows, Chinese are the most numerous of these six groups, Japanese the least.
Asian Americans have a long history in the United States, dating to the early 19th century, when thousands came to work in agriculture, construction and other low-wage jobs. The Asian-American population grew slowly for more than a century because severe restrictions or outright prohibitions were imposed on most immigration from Asia. Most Asian Americans now living in the U.S. arrived as a result of passage of 1965 immigration legislation that opened admission to people from a wider range of countries.
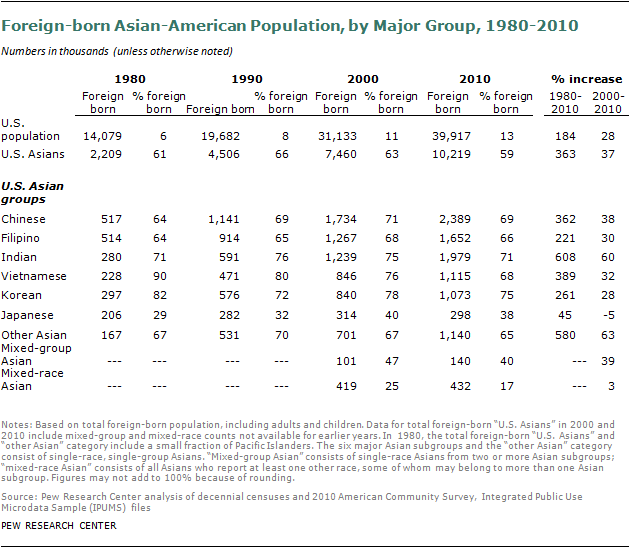
As new opportunities to immigrate became available, the foreign-born Asian-American population, which numbered only 2.2 million in 1980, grew by 2.3 million over the 1980s and 2.9 million in the 1990s. From 2000 to 2010, the Asian-American immigrant population increased by an additional 2.8 million.
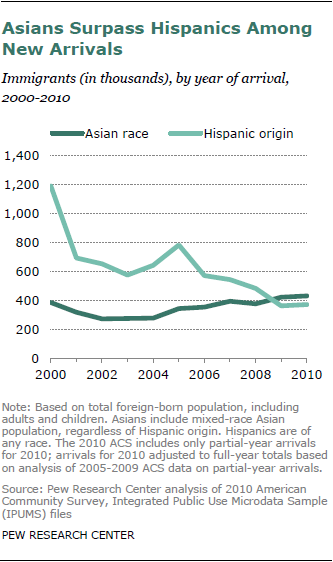
The Asian-American immigrant population has grown rapidly over the past decade as a result of continued large flows from Asia. By contrast, new immigration from Latin America, while still significant, has fallen considerably since the middle of the last decade. As a result, according to a Pew Research Center analysis of Census Bureau data, the number of newly arrived Asian-American immigrants has surpassed the number of newly arrived Hispanic immigrants since at least 2009.
About 36% of new immigrants in 2010 were Asian, compared with 31% who were Hispanic. About 430,000 Asian immigrants arrived in the U.S. in 2010, compared with about 370,000 Hispanics. As recently as 2007, the numbers were about 390,000 (Asians) and 540,000 (Hispanics). These totals include arrivals with both legal and unauthorized status, as well as those arriving with work, student or other temporary visas.18
Unauthorized Asian-American immigrants account for about 10-11% of the U.S. unauthorized population and about 13-15% of the Asian immigrant population during the 2000-2010 decade, according to a Pew Research Center analysis of government data.19 In contrast, Hispanic unauthorized immigrants account for about three-quarters of the U.S. unauthorized population and about 45% of Hispanic immigrants.
Most Asian immigrants who obtain green cards—that is, permanent resident status—do so via sponsorship by family members, as is true of all immigrants. But Asian immigrants are notably more likely than immigrants from other nations to be admitted with employment visas.
In 2011, according to Department of Homeland Security statistics,20 62% of immigrants from the six largest Asian source countries received green cards based on family members already in the U.S., compared with 66% of other immigrants who did so. Among immigrants from these Asian nations, 27% received green cards based on employer sponsorship, compared with 8% of other immigrants who did so. The share has varied throughout the past decade but has been markedly higher for Asian immigrants than for others.
However, considerable variation exists among the top six countries of origin. In 2011, the shares of immigrants granted green cards for employment reasons were about half or more for those from Korea (55%) and India (49%), as well as 33% for Japan and 21% for China. The shares were far lower for immigrants from the Philippines (13%) and Vietnam (1%).
Geographically, Asian Americans are disproportionately likely to live in Western states (46% did in 2010, compared with 23% of the U.S. population overall).21 This residential pattern reflects historic ports of arrival for most Asian Americans, as well as the immigrant pattern of moving to established enclaves.
According to projections by the Pew Research Center,22 the nation’s Asian-American population will continue to grow more rapidly than the U.S. population overall, and it will be less dominated by immigrants than it now is. The Asian population will grow to 41 million in 2050, nearly tripling in size. Nearly all of the future growth in the Asian population (94%) will be due to immigrants arriving after 2005 and their descendants. But arrivals of new immigrants will play a declining role in Asian population change, and births in the United States to immigrants and their descendants will play a growing role. In 2005, most Asians in the United States (58%) were foreign born; by 2050, fewer than half (47%) will be foreign born.
Within the Asian-American population are diverse histories, languages, cultures and characteristics, which are discussed later in this chapter in separate sections for each of the six largest countries of origin. Asian Americans also share distinct economic and demographic characteristics as a group, especially in the realms of nativity, educational attainment, income and family structure.
Who Are Asian Americans?
Asian Americans are a diverse group in the United States. According to the U.S. Census Bureau, “Asian” refers to a person having origins in any of the original peoples of the Far East, Southeast Asia or the Indian subcontinent. The Asian population includes people who indicated their race(s) as “Asian Indian,” “Chinese,” “Filipino,” “Japanese,” “Korean.” “Vietnamese” or “Other Asian,” or wrote in entries such as “Pakistani,” “Thai,” “Cambodian” or “Hmong.”
In this report, the terms “group” or “subgroup” or “country of origin group” are used interchangeably to refer to populations who indicated their race as “Asian Indian,” “Chinese,” “Filipino,” and so forth. “Country of origin” does not necessarily mean birth country but can refer to ancestry or family heritage.
With growing diversity in the nation’s population, the Census Bureau has changed the wording of questions about race and ethnicity over time. Since Census 2000, respondents could select one or more race categories to indicate their racial identities. (About 15% of the Asian population reported multiple races in Census 2010.) In addition, since Census 2000, the Native Hawaiian and Other Pacific Islander population, formerly included with the totals for the Asian population, has been counted as a separate race group. Because of these changes, caution is advised in historical comparisons on racial composition of Asians.
In this report, “Asian American” includes all Asians living in the United States, regardless of citizenship or immigration status. It includes foreign citizens living in the United States for study, work or other purposes, but not those on short-term visits. Unless otherwise noted, the maximum number of Asians is counted for the overall Asian population and for Asian subgroups in the report. This includes single-race Asians as well as mixed-race Asians. Asian Americans do not include Native Hawaiian and Other Pacific Islanders, but (except where specified) do include some Asians of Hispanic ethnicity, who were approximately 1.4% of the Asian population in 2010.
Throughout the report, data from Census 2010 and earlier decennial censuses are used for basic population counts and trends, as well as for analysis of the mixed-race Asian population. Estimates from the 2010 American Community Survey are used for social and economic characteristics of Asian Americans and their subgroups. In most cases, characteristics are reported for the adult population.
Race and Nativity
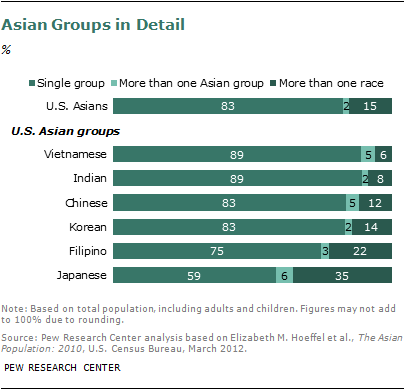
The six major country groups vary markedly in the shares that are only one race. More than a third (35%) of Japanese Americans identify themselves as multiracial, and an additional 6% are of mixed-Asian heritage. By contrast, only 6% of Vietnamese report being of mixed race and an additional 5% report a mixed-Asian background. The difference is in part a reflection of assimilation and of the Japanese-American population’s longer history in the U.S.
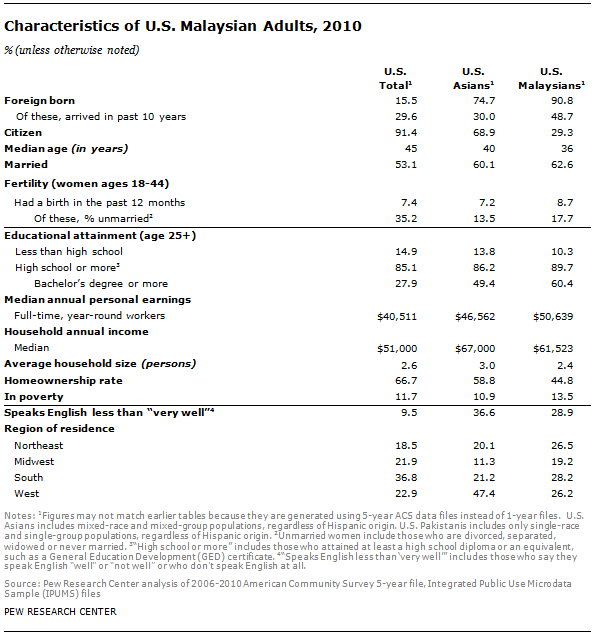
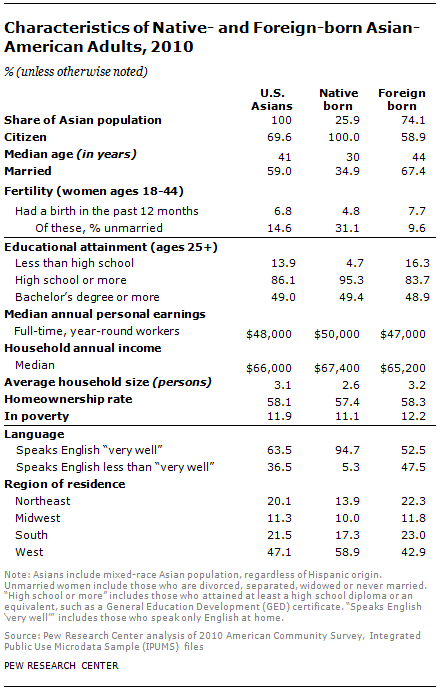
Most Asian Americans are foreign born—59%, compared with 13% of the U.S. population overall in 2010.23 (The share is even higher for adults—74%, compared with 16%.) The share varies by country of origin, from a low of 38% for single-race Japanese to 75% for single-race Koreans. These differences largely reflect the timing of each group’s major influx of immigration.
The Asian-American native-born adult population is evenly split between males and females, but the foreign-born Asian population has more females than males—54% of women versus 46% of men. Among foreign-born Japanese-American adults, the female-to-male ratio is more than 2-to-1. The exception is foreign-born Indian-American adults; there are slightly more men than women in this group.
Just over half of foreign-born Asian-American adults either speak only English at home or speak English very well (53%), a standard measure of language proficiency. (That share from the Census Bureau’s 2010 American Community Survey is similar to the 49% of foreign-born Asian-American adults in the 2012 Pew Research Center Asian-American survey who say they speak English very well.) The share of Asian-American adults who speak only English or speak English very well is modestly higher than for other U.S. foreign-born adults (45%), according to census data.
Looking at two measures of attachment to the U.S.—emigration and naturalization—Asian immigrants are less likely to leave than other groups and more likely to become citizens.
Emigration from the U.S. by former immigrants is difficult to measure precisely. However, various estimates of overall emigration generally are in the range of 1% to 1.5% per year, and Asian emigration appears to be a bit lower than average.24
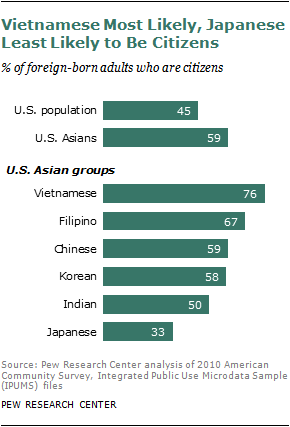
As for citizenship, 59% of foreign-born Asian adults in the U.S. are naturalized citizens, compared with 45% of all foreign-born adults. The share varies notably among different subgroups. Only a third of immigrant Japanese adults (33%) are citizens, compared with three-quarters (76%) of Vietnamese immigrant adults.
Education
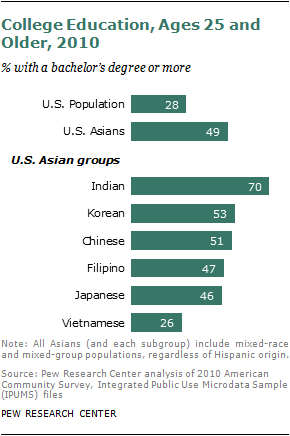
Educational attainment among Asian Americans is markedly higher than that of the U.S. population overall. Among those ages 25 and older, 49% hold at least a college degree, compared with 28% of the U.S. population overall. As with nativity, the share among those ages 25 and older varies by country of origin: Vietnamese (26%) are the only group below the U.S. share, and Indians (70%) are much higher.
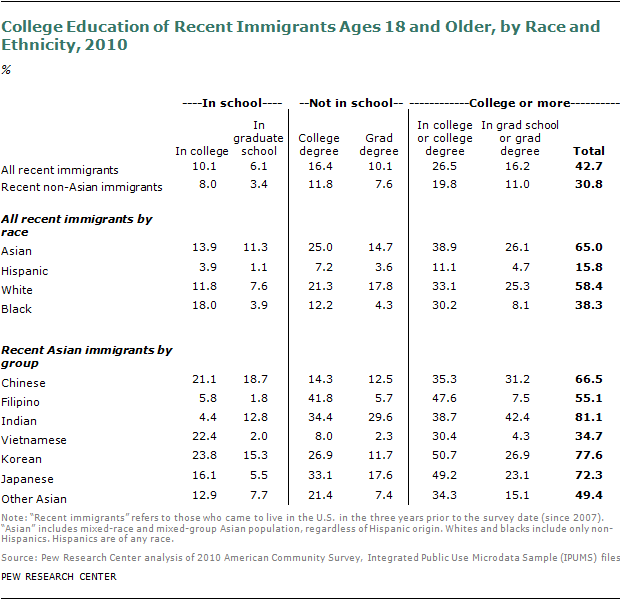
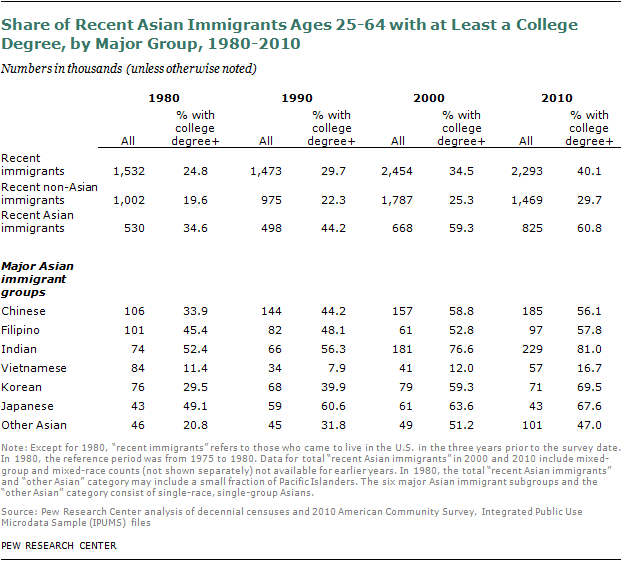
Educational attainment is especially notable among recent immigrants from Asia, those who arrived in the three years prior to the 2010 American Community Survey. In 2010, 61% of those ages 25 to 64 held a college degree (compared with 30% of other recent immigrants ages 25 to 64).25
Recent Indian immigrants ages 25 to 64 are most likely to hold a college degree (81%), but more than half of comparably aged new immigrants from China, the Philippines, Korea and Japan also are college-educated. Only 17% of recent immigrants ages 25 to 64 from Vietnam are college-educated, however.
Compared with the educational attainment of the population of their country of origin, recent Asian immigrants are a select group. For example, about 27% of adults ages 25 to 64 in South Korea and 25% in Japan have a bachelor’s degree or more.26 In contrast, nearly 70% of comparably aged recent immigrants from these two countries have at least a bachelor’s degree.
Using a broader measure—the share enrolled in college or holding a college degree—the educational characteristics of recent Asian immigrants also compare favorably with those of other races.
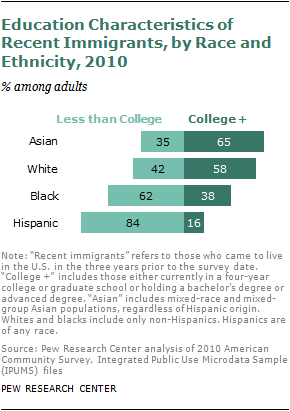
Among Asian immigrant adults ages 18 and older who arrived in 2007-2010, nearly two-thirds (65%) were enrolled in college or graduate school, or held a college degree. This share was higher than for comparable white recent immigrants (58%) and markedly higher than for black (38%) or Hispanic (16%) recent immigrants.
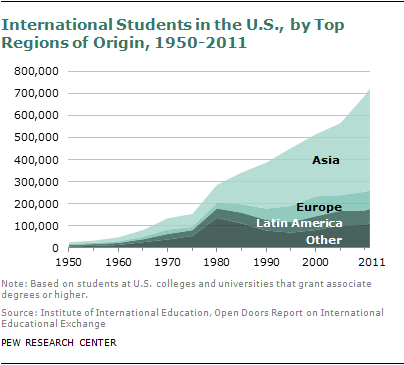
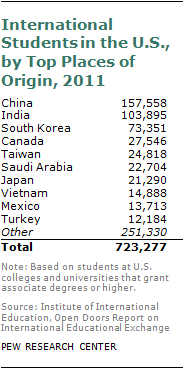
Young adults from Asian countries are overrepresented among current students, accounting for more than six-in-ten of all foreign students studying at U.S. institutions. China, India and South Korea are the top three countries whose students are studying in the U.S., with Taiwan ranking fifth (behind Canada) and Japan and Vietnam ranking seventh and eighth (behind Saudi Arabia).
Asian students, both foreign born and U.S. born, also are heavily overrepresented in the awarding of U.S. advanced degrees. In 2010, Asian students accounted for 25% of the 48,069 research doctorates granted at U.S. universities. They collected a plurality (45%) of all engineering Ph.D.s awarded that year, as well as 38% of doctorates in math and computer sciences; 33% of doctorates in the physical sciences; 25% of those in the life sciences; and 19% of those in the social sciences.27
Employment
One reflection of their high level of educational attainment is that half of employed Asian Americans (50%) are in management, professional and related occupations, a higher share than the roughly 40% for employed Americans overall. Many of these occupations require advanced degrees.
However, the proportion in these occupations varies by group. Among Indians, two-thirds hold such jobs, as do more than half of Chinese and Japanese. Slightly less than half of Filipinos and Koreans hold management and professional jobs. Among Vietnamese, only about a third do.
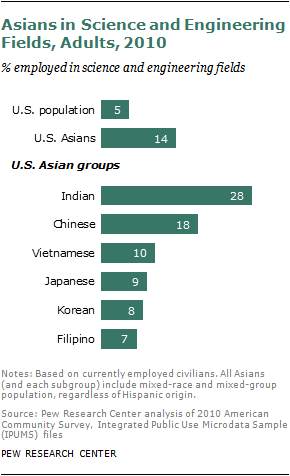
These high levels of educational attainment are a factor in the occupational profile of Asian Americans, especially their concentration in the fields of science and engineering. Among adults, 14% of Asian Americans hold these types of jobs, compared with 5% of the U.S. population overall. The share among Indians is 28%.
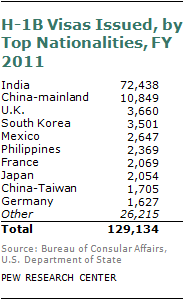
Another facet of the Asian-American occupational profile is the high share of immigrants from Asian countries who are in the U.S. under the H1-B visa program. These visas were authorized under the Immigration and Nationality Act in 1990 to increase the inflow of highly skilled “guest workers” from abroad. Asian countries are now the source of about three-quarters of such temporary visas. In 2011, India alone accounted for 72,438 of the 129,134 H1-B visas granted, or 56%; China was responsible for 10,849, or 8%.
A somewhat lower share of Asian Americans, compared with all employed Americans, are in jobs that include labor, maintenance and transportation—11%, compared with 15%. However, the shares for country groups are all below the national share except for Vietnamese—20% of employed Vietnamese Americans hold these types of jobs.
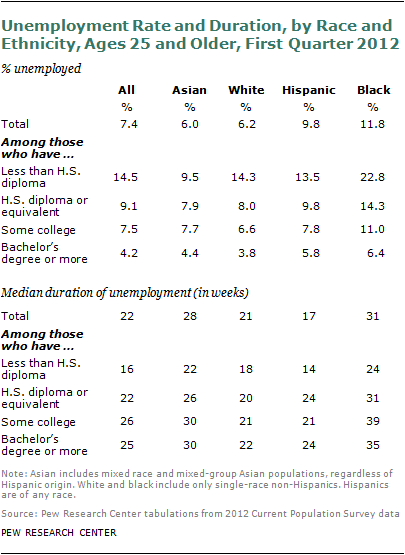
Looking at recent unemployment statistics, Asian Americans were somewhat less likely to be unemployed than the national average for the first quarter of 2012 (6% compared with 7% for workers ages 25 and older).28 However, the gap differs by educational attainment. Less educated Asian Americans, those with no college education, had lower unemployment than comparably educated workers overall. But Asian Americans with some college or a college degree had about the same level of unemployment as comparably educated workers overall.
One defining feature of the recent recession and slow economic recovery has been a high level of long-term unemployment. On this measure, Asian Americans have fared worse than workers overall, and most other race groups. Among workers ages 25 and older who were unemployed in the first quarter of 2012, the median duration of unemployment for Asian Americans was 28 weeks, second only to black workers among the major race and ethnic groups. The median duration of unemployment was worse for Asian Americans than for all workers at each level of educational attainment.
Income
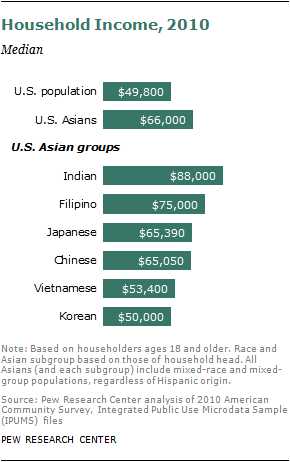
Educational attainment and occupational patterns are key factors in explaining the above-average household incomes for Asian Americans as a whole—a median $66,000 in 2010, vs. $49,800 for the U.S. population—and for most country of origin groups.
Median income may also be viewed in the context of number of earners per household and household size. Asian-American households have more earners on average than U.S. households overall—1.6 compared with 1.4. Additional earners help boost overall household income.
In addition, the average Asian-American household (3.1 people) is larger than the average U.S. household (2.6), and larger households mean that income must be divided among a larger number of people.
To add another perspective to the analysis, the Pew Research Center adjusted median household incomes for household size differences and standardized income to a household size of three.29 Based on that adjustment, the median household income for all U.S. households is 82% of the median household income of Asian Americans, compared with 75% when household incomes are not adjusted.
Geography may also be a factor in explaining these income differences. According to some analysts,30 higher incomes can be linked to the geographic concentration of Asian Americans in states with higher incomes and higher costs of living.
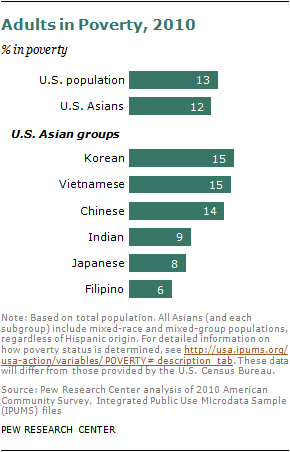
Wealth and Poverty
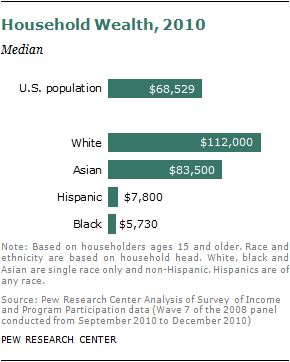
Median household wealth for Asian Americans was $83,500 in 2010, according to a Pew Research Center analysis of data from the Census Bureau’s Survey of Income and Program Participation, considered the most comprehensive source of information about wealth by race and ethnicity. Wealth is defined as net worth, or the sum of assets (such as cars, homes, savings and retirement accounts) minus debts (such as mortgages, auto loans and credit card debt).
Asian-American wealth in 2010 was higher than the median net worth for households overall ($68,529). Compared with other race or ethnic groups, Asian Americans had lower median household wealth than non-Hispanic whites ($112,000). But Asian-American wealth was notably higher than it was for Hispanics ($7,800) or for blacks ($5,730).
Asian-American adults overall are somewhat less likely to be poor than U.S. adults overall (11.9% for Asian Americans, compared with 12.8% for the U.S.). The share of the population living below the poverty line varies widely by country of origin, ranging from 6.2% for Filipino adults to 15.1% for Korean adults.
Family Structure
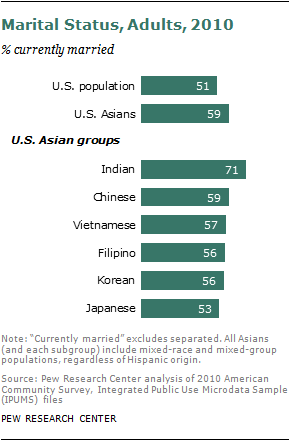
In terms of family structure, Asian Americans are more likely to be currently married than U.S. adults overall and to have lower rates of birth outside of marriage. The current differences reflect in large part the heavy immigrant presence among Asian Americans. As a group, Asian-American adults are more likely to be married than the U.S. population overall—59%, compared with 51%. Among foreign-born Asian-American adults, two-thirds (67%) are married. Among U.S.-born Asian-American adults, 35% are married, in part because they are younger.
According to the 2010 American Community Survey, among women ages 18 to 44 who gave birth in the previous year, only 15% of Asian Americans were unmarried, compared with 37% for the population overall. Among foreign-born Asian-American mothers ages 18 to 44, only 10% were unmarried, illustrating the strong influence of the immigrant population on the overall Asian-American data.
According to another data source, the National Center for Health Statistics, Asian-American and Pacific Islander women of childbearing age (15-44) are about as likely as other women to have given birth in the past year. But only 16% of births to Asian-American and Pacific Islander women in 2009 were to unmarried mothers, compared with 41% for the overall population. Among foreign-born Asian Americans and Pacific Islanders, only 12% of births were to unmarried women.31
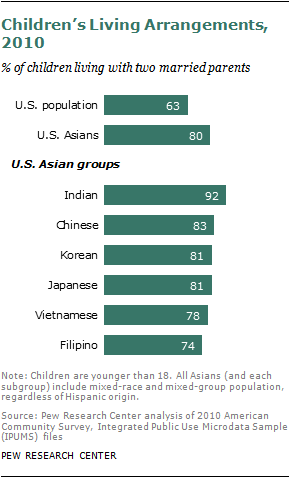
One result of these marriage and birth status profiles is that Asian-American children are notably more likely than U.S. children overall to live with two married parents—80% to 63%, according to the 2010 ACS. Some variation exists by subgroup, from 74% of Filipino children to 92% of Indian children.
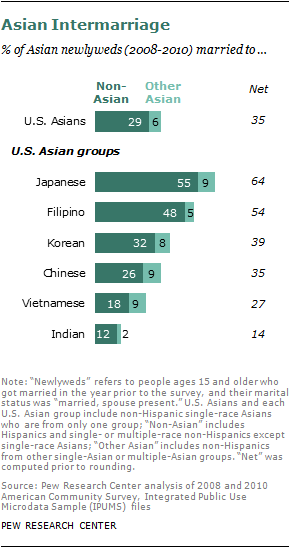
There are differences among Asian-American subgroups in the share of newlyweds marrying someone of a different race. Among all recent Asian-American newlyweds (2008-2010), 29% married someone of another race and 6% married someone from another Asian group.32
The majority of recent Japanese-American newlyweds married someone of another race (55%) or Asian subgroup (9%). The same was true for Filipino Americans; 48% married someone who was not Asian American, and 5% married someone from another Asian group. Koreans (39%), Chinese (35%) and Vietnamese (27%) were somewhat less likely to marry outside their race or subgroup.
Indian Americans are the least likely among Asian-American groups to marry out—only 12% married someone of another race, and 2% married someone from another Asian group.
For more about attitudes toward intermarriage from the 2012 Asian-American survey, see Chapter 3.
Multi-generational families—those with two or more adult generations (or a grandchild and grandparent) living under one roof—are more common in households headed by Asian Americans than those headed by a member of other race and ethnic groups. Multi-generational homes in 2010 accounted for more than a quarter (28%) of all people living in households headed by non-Hispanic Asians. That is somewhat higher than for households headed by non-Hispanic blacks (26%) and Hispanics (25%) and notably higher than for non-Hispanic whites (14%).
The likelihood of multi-generational living varies markedly by Asian-American group. Residents of households headed by someone who is Vietnamese (34%) or Filipino (33%) are most likely to be in multi-generational families. People in households with Korean (20%) or Japanese (18%) heads are least likely to be in multi-generational families. In between are residents of households with heads who are Chinese (26%) or Indian (23%).
Region of Residence
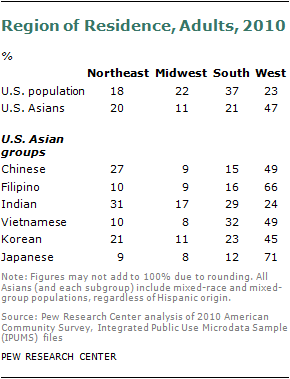
Nearly half of Asian-American adults (47%) live in Western states, double the share of U.S. residents overall. This largely reflects historic immigration patterns.
The Northeast and South each are home to about a fifth of Asian-American adults. Asian Americans are least likely to live in the Midwest; only 11% of adults do.
Residential settlement patterns vary greatly among different country of origin groups. The West is home to most Japanese-American adults (71%) and most Filipino-American adults (66%). Among adults, Chinese Americans, Vietnamese Americans and Korean Americans also are more likely to live in the West than in any other region.
However, Indian-American adults are more evenly distributed around the country, and the West is not their first choice of residential region. The largest share of Indian-American adults (31%) live in the Northeast, followed by the South (29%), West (24%) and Midwest (17%).
Residential Segregation
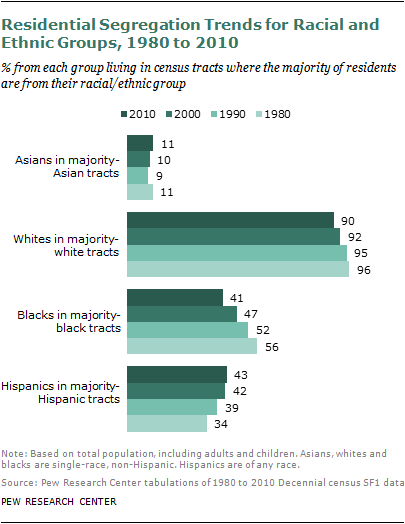
By several measures of residential segregation, Asian Americans33 are less isolated than either blacks or Hispanics. In 2010, the typical Asian American lived in a census tract with a lower share of his or her own race and a higher share of non-Hispanic whites than did the typical black or Hispanic; Asian Americans also are less segregated than whites. However, looking at long-term trends, Asian Americans (and Hispanics) are at least as segregated as they were in 1980, while black segregation has declined somewhat.
In 2010, the average Asian American lived in a census tract in which Asians were 20% of the tract’s residents.34 By comparison, the typical black lived in a tract that was 45% black and the typical Hispanic lived in a tract that was 45% Hispanic. (This comparison should be treated with caution: Other race and Hispanic groups are more numerous than Asians, and so they have greater potential to cluster). Asian Americans also are likely to have a higher share of non-Hispanic whites in their neighborhoods than do blacks or Hispanics. In 2010 the typical Asian American resided in a tract in which non-Hispanic whites were 48% of the tract’s population, compared with 36% for the typical non-Hispanic black and 37% for the typical Hispanic.
Asian Americans are less segregated than other groups under another often-used measure of residential segregation—the dissimilarity index, which captures the degree to which a population is unevenly spread among census tracts of a metropolitan area. It ranges between 0 and 1, with higher values revealing that a group is more highly concentrated, or segregated. In 2010, Asian-white dissimilarity was 0.41, compared with 0.59 for black-white dissimilarity and 0.48 for Hispanic-white dissimilarity.35
Looking at change from 1980 to 2010, the Asian-American population is at least as segregated today as it was three decades ago, although the level of segregation between those years varies depending on the measure used.36
In 2010, 11% of Asian Americans lived in a census tract in which at least half of the tract’s residents were Asian, the same share as in 1980. By comparison, in 2010, 43% of Hispanics lived in a majority-Hispanic tract, compared with 34% in 1980. Both groups grew rapidly during this period.
The black population grew more slowly, and African Americans are markedly less likely to live in majority black census tracts in 2010 (41%) than in 1980 (56%). Non-Hispanic whites are also less likely to reside in majority white tracts in 2010 (90%) than in 1980 (96%).
U.S. Immigration Laws and Asian Americans
Although Asian Americans have immigrated to the U.S. since at least the mid-1800s, it was not until 60 years ago that foreign-born Asian Americans were permitted to become U.S. citizens (those born in the U.S. were granted birthright citizenship by a Supreme Court ruling in 1898). In addition, immigration from Asia was severely restricted for many years as a result of many state and national laws that had the effect of limiting immigration and naturalization. For example, some states prohibited non-citizen Asians from owning land, barred Asians from marrying whites or imposed extra taxes on non-citizen Asians.
Among the major laws, court cases and other government actions affecting immigration or immigrants from Asia:
- 1790: Naturalization Act, which limited citizenship to “free white persons.”
- 1882: Chinese Exclusion Act, which barred Chinese immigrants for 10 years (later extended). This law also prohibited Chinese immigrants from naturalizing. Provisions repealed in 1943.
- 1907: Gentlemen’s Agreement, in which Japan and the U.S. agreed to stop issuance of passports for new Japanese laborers to come to the U.S., but the U.S. allowed immigration of family members of Japanese residents already in the country.
- 1917: Immigration Act, which barred immigration from most countries in Asia.
- 1923: A U.S. Supreme Court ruling, which said Indians from Asia were not white, reversing previous court decisions allowing them to become citizens.
- 1924: National Origins Act, which extended earlier prohibitions on Asian immigration but exempted Filipinos, who lived in an American territory.
- 1942: A presidential order during World War II that allowed the secretary of war to remove Japanese Americans from certain areas; eventually, 120,000 were interned in camps.
- 1945: The War Brides Act, which allowed the entry, with no quotas, of foreign-born women married to U.S. servicemen.
- 1952: McCarran-Walter Immigration and Naturalization Act, which allowed Asian Americans to become naturalized U.S. citizens.
- 1965: Immigration and Nationality Act, which opened the doors for new immigration from Asia. Spouses, children under 21 and parents of U.S. citizens could be admitted without quotas. The law allowed up to 20,000 immigrants per country and 170,000 from the Eastern Hemisphere; family members and some categories of skilled workers were favored.
- 1980: Refugee Act, which redefined refugees more broadly, thus granting asylum to boat people escaping Vietnam.
- 1990: Immigration Act, which increased the ceiling on new immigrant visas, especially for family members of U.S. citizens and for skilled foreigners requested by U.S. employers.
Much of the information in this box, as well as the history throughout this chapter, is drawn from the following: Fong, Timothy R., 2008. “The Contemporary Asian American Experience: Beyond the Model Minority.” Upper Saddle River, NJ: Pearson Prentice Hall; Takaki, Ronald, 1998. “Strangers from a Different Shore: A History of Asian Americans.” Updated and revised edition. New York, NY: Back Bay Books, Little, Brown and Company; and Xie, Yu and Kimberly A. Goyette, 2004. “A Demographic Portrait of Asian Americans.” Washington, D.C.: Population Reference Bureau.
II. Characteristics of Major Asian-American Subgroups
Chinese Americans
History
Chinese were among the first Asian immigrants to the United States. The California gold rush that began in 1848 attracted Chinese merchants and sailors initially, and larger scale immigration began in 1852 when 52,000 Chinese arrived. Chinese laborers made up 90% of the workforce for the construction of the Central Pacific Railroad.
As early as 1870, Chinese were 9% of California’s population and 25% of its workforce. (The first Asian response category in the decennial census—“Chinese”—was added in California in 1860, and in other states the following decade.) Most were young single men who intended to work a few years and then return to China. Those who stayed seldom married because of laws severely limiting the immigration of Chinese women and prohibiting intermarriage with white women.
As gold became harder to find and railroad construction was completed, animosity toward the Chinese and other foreigners increased. After being forcibly driven from the gold mines, most Chinese settled in enclaves in cities, mainly San Francisco, and took up low-wage labor.
Often brought in to factories after white workers went on strike over labor practices, Chinese workers were blamed by labor leaders for the depressed wage levels in the 1870s and were a frequent target of hatred and racial violence. A succession of laws, including the 1882 Chinese Exclusion Act, prohibited Chinese people from naturalizing or immigrating.
The Chinese population reached its 19th-century peak in 1890 at about 107,000 people. Because of anti-Chinese laws, the highly imbalanced male-to-female ratio and the thousands of immigrants returning to China, the Chinese population in the U.S. fell to less than 50,000 in 1920.37
Later on, immigration of all Asians, except Filipinos who were residents of a U.S. territory at that time, was prohibited by immigration laws, including the 1917 Immigration Act and the National Origins Act of 1924.
Large-scale immigration of Chinese started again after 1965, following passage of the landmark Immigration and Nationality Act. Many Chinese came as students and later obtained permanent resident visas. In contrast to earlier waves of immigrants, those of the past four decades are more likely to include educated professionals.
In 2010, an estimated 3 million adult Chinese Americans were in the U.S., according to the Census Bureau’s American Community Survey. Chinese Americans are the largest group among Asian Americans and represent about 24% of the adult Asian population in the U.S.
Characteristics (2010 ACS)
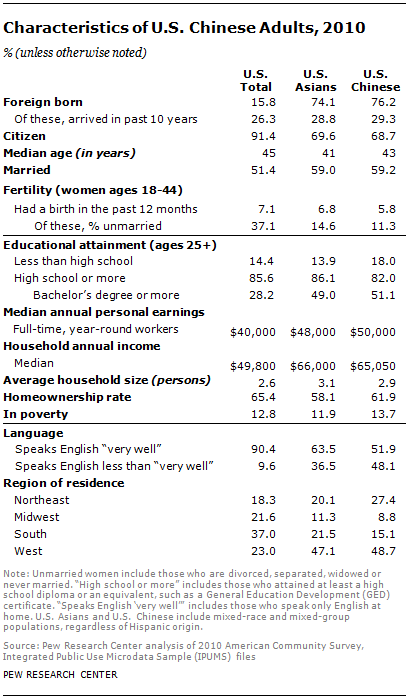
- Nativity and citizenship. Three-quarters (76%) of adult Chinese Americans in the United States are foreign born, similar to the share among all Asian adults (74%) and higher than the 16% share of all U.S. adults. The majority of Chinese adults are U.S. citizens (69%), similar to the share among the adult Asian population (70%) but lower than the national share (91%).
- Language. More than half of Chinese Americans (52%) speak English proficiently,38 compared with 63% of Asian Americans in general and 90% of the U.S. population overall.
- Age. The median age of adult Chinese Americans is 43, slightly higher than among adult Asian Americans (41) and slightly lower than the national median (45).
- Marital status. Nearly six-in-ten (59%) adult Chinese Americans are married, a share equal to that among Asian Americans overall and higher than the national share (51%).
- Fertility. The share of Chinese-American women ages 18 to 44 who gave birth in the 12 months before the 2010 ACS was 5.8%; this is lower than the comparable share among Asian-American women overall (6.8%) and the national share (7.1%). About 11% of Chinese-American women who gave birth in the previous 12 months were unmarried, slightly lower than among all Asian-American women (15%) and much lower than the national share (37%).
- Educational attainment. Among Chinese Americans ages 25 and older, more than half (51%) have obtained at least a bachelor’s degree; this is higher than the Asian-American share (49%) and much higher than the national share (28%).
- Income. Median annual personal earnings for Chinese-American full-time, year-round workers are $50,000, higher than for Asian Americans overall ($48,000) and for U.S. adults overall ($40,000). For households, the Chinese median annual income ($65,050) is somewhat lower than that for all Asians ($66,000) but higher than that among U.S. households overall ($49,800).
- Homeownership. More than six-in-ten Chinese Americans (62%) own a home, compared with 58% of Asian Americans overall and 65% of the U.S. population overall.
- Poverty status. The share of adult Chinese Americans who live in poverty is 14%, slightly higher than the shares of all Asian Americans (12%) and of the U.S. population overall (13%).
- Regional dispersion. Nearly half of adult Chinese Americans (49%) live in the West, compared with 47% of Asian Americans and 23% of the U.S. population overall.
Attitudes
Here are a few key findings from the 2012 Asian-American survey about Chinese Americans compared with other major U.S. Asian groups:
- Compared with other U.S. Asian groups, Chinese Americans are among the most likely to say discrimination against people from their country of origin is a major (16%) or minor (56%) problem. A quarter (24%) say discrimination is not a problem.
- Chinese Americans are less upbeat than most other U.S. Asian groups about their relationships with other major racial and ethnic groups. Only about two-in-ten say Chinese Americans and whites get along very well. And even fewer say Chinese Americans get along very well with blacks or Hispanics.
Filipino Americans
History
Filipino immigration to the U.S. began after the United States acquired the Philippines in 1898 as a result of the Spanish-American War. A large number of Filipinos went directly to Hawaii to work on plantations before coming to the U.S. mainland.39
Filipinos were the only Asian group who lived on American territory and were therefore exempted from the 1917 and 1924 laws that prohibited Asian immigration to the country. Filipinos began to move to the U.S. mainland following the passage of the immigration law that excluded other Asians, amid increasing need for agricultural and service labor.
However, severe limits were placed on Filipino immigration when the Philippines was established as a commonwealth of the U.S. in 1934. The Filipino population in the U.S. dropped from about 108,000 to 98,000 in the decade that followed. The Philippines became an independent nation in 1946. After passage of the 1965 Immigration and Nationality Act, many Filipinos came to the U.S. to escape the Ferdinand Marcos regime and find more opportunities for employment.
In 2010, an estimated 2.3 million adult Filipino Americans lived in the U.S., according to the Census Bureau’s American Community Survey. Filipinos are the second-largest group among Asian Americans and represent about 18% of the adult Asian population in the U.S.
Characteristics (2010 ACS)
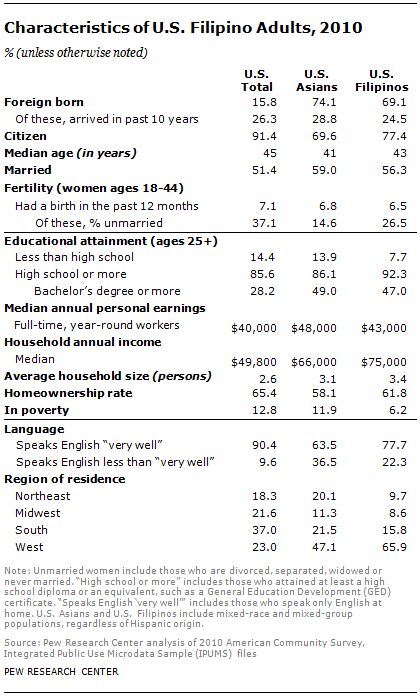
- Nativity and citizenship. Nearly seven-in-ten (69%) adult Filipino Americans in the United States are foreign born, compared with about 74% of adult Asian Americans and 16% of the overall adult U.S. population. Three-quarters of Filipino adults are U.S. citizens (77%), higher than the share among all Asian adults (70%) but lower than the national share (91%).
- Language. More than three-quarters of Filipino Americans (78%) speak English proficiently,40 compared with 63% of Asian Americans overall and 90% of the U.S. population overall.
- Age. The median age of adult Filipino Americans is 43, slightly higher than for adult Asian Americans (41) and slightly lower than the national median age (45).
- Marital status. More than half of adult Filipino Americans (56%) are married, a share slightly lower than that among Asian Americans overall (59%), but higher than the national share (51%).
- Fertility. The share of Filipino-American women ages 18 to 44 who gave birth in the 12 months prior to the 2010 American Community Survey was 6.5%; this is similar to the comparable share among Asian-American women overall (6.8%) and lower than the national share (7.1%). About 27% of Filipino-American women who gave birth in the previous 12 months were unmarried, nearly double the share for all Asian-American women (15%) but lower than the national share (37%).
- Educational attainment. Among Filipino Americans ages 25 and older, close to half (47%) have obtained at least a bachelor’s degree; this is slightly lower than the Asian-American share (49%) but much higher than the national share (28%).
- Income. Median annual personal earnings for Filipino-American full-time, year-round workers are $43,000, lower than for all Asian Americans in general ($48,000) but higher than for U.S. adults overall ($40,000). Among households, median annual income for Filipinos is $75,000, higher than for all Asians ($66,000) and all U.S. households ($49,800).
- Homeownership. More than six-in-ten Filipino Americans (62%) own a home, compared with 58% of all Asian Americans and 65% of the U.S. population overall.
- Poverty status. The share of adult Filipino Americans who live in poverty is 6%, lower than the shares of all Asian Americans (12%) and of the U.S. population overall (13%).
- Regional dispersion. A majority of adult Filipino Americans (66%) live in the West, compared with 47% of Asian Americans and 23% of the U.S. population overall.
Attitudes
Here are a few key findings from the 2012 Asian-American survey about Filipino Americans compared with other major U.S. Asian groups:
- Filipino Americans stand out among U.S. Asian groups for their low levels of social trust: 73% say you can’t be too careful in dealing with people, while only 23% say most people can be trusted.
- Compared with most other U.S. Asian groups, Filipino Americans have a more positive view of the job parents from their country of origin are doing raising their children. Roughly six-in-ten (64%) say parents who share their Filipino heritage put about the right amount of pressure on their children to do well in school; 22% say Filipino American parents put too much pressure on their children; and 13% say they don’t put enough pressure on children.
Indian Americans
History
The arrival of more than 6,000 Indians from Asia between 1904 and 1911, mainly to work as farmhands, marked the first major influx of this population into the United States. Indians from Asia in the U.S. were first classified in court decisions of 1910 and 1913 as Caucasians, and therefore could become citizens as well as intermarry with U.S.-born whites. However, the decisions were reversed by the Supreme Court in 1923, when Indians from Asia were legally classified as non-white and therefore ineligible for citizenship.
That court decision prevented Indian immigrants from naturalizing. New immigration from India already had been prohibited by a 1917 law.
The restrictions were lifted after passage of comprehensive immigration legislation in 1965. Since then, a large influx of highly educated professionals from India has immigrated to the U.S. for skilled employment. In 2010, an estimated 2.2 million adult Indian Americans lived in the U.S., according to the Census Bureau’s American Community Survey. Indians are the third-largest group among Asian Americans and represent about 17% of the U.S. adult Asian population.
Characteristics (2010 ACS)
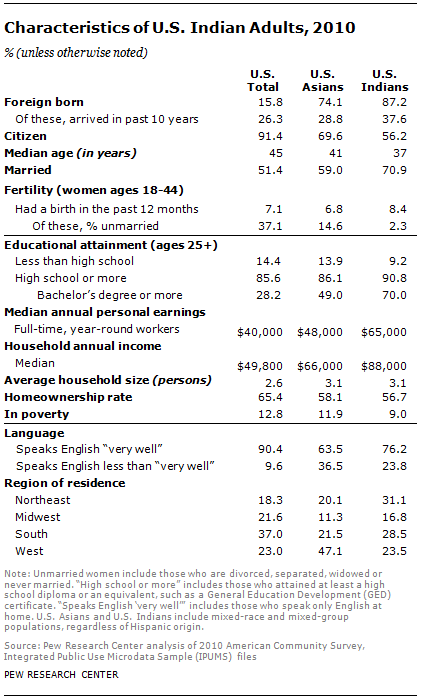
- Nativity and citizenship. Nearly nine-in-ten (87%) adult Indian Americans in the United States are foreign born, compared with about 74% of adult Asian Americans and 16% of the adult U.S. population overall. More than half of Indian-American adults are U.S. citizens (56%), lower than the share among overall adult Asian population (70%) as well as the national share (91%).
- Language. More than three-quarters of Indian Americans (76%) speak English proficiently,41 compared with 63% of all Asian Americans and 90% of the U.S. population overall.
- Age. The median age of adult Indian Americans is 37, lower than for adult Asian Americans (41) and the national median (45).
- Marital status. More than seven-in-ten (71%) adult Indian Americans are married, a share significantly higher than for all Asian Americans (59%) and for the nation (51%).
- Fertility. The share of Indian-American women ages 18 to 44 who gave birth in the 12 months prior to the 2010 American Community Survey was 8.4%, higher than the comparable share for Asian-American women overall (6.8%) and the national share (7.1%). The share of these mothers who were unmarried was much lower among Indian Americans (2.3%) than among all Asian Americans (15%) and the population overall (37%).
- Educational attainment. Among Indian Americans ages 25 and older, seven-in-ten (70%) have obtained at least a bachelor’s degree; this is higher than the Asian-American share (49%) and much higher than the national share (28%).
- Income. Median annual personal earnings for Indian-American full-time, year-round workers are $65,000, significantly higher than for all Asian Americans ($48,000) as well as for all U.S. adults ($40,000). Among households, the median annual income for Indians is $88,000, much higher than for all Asians ($66,000) and all U.S. households ($49,800).
- Homeownership. More than half of Indian Americans (57%) own a home, compared with 58% of Asian Americans overall and 65% of the U.S. population overall.
- Poverty status. The share of adult Indian Americans who live in poverty is 9%, lower than the shares of all Asian Americans (12%) and of the U.S. population overall (13%).
- Regional dispersion. Indian Americans are more evenly spread out than other Asian Americans. About 24% of adult Indian Americans live in the West, compared with 47% of Asian Americans and 23% of the U.S. population overall. More than three-in-ten (31%) Indian Americans live in the Northeast, 29% live in the South, and the rest (17%) live in the Midwest.
Attitudes
Here are a few key findings from the 2012 Asian-American survey about Indian Americans compared with other major U.S. Asian groups:
- Indian Americans stand out from most other U.S. Asian groups in the personal importance they place on parenting; 78% of Indian Americans say being a good parent is one of the most important things to them personally.
- Indian Americans are among the most likely to say that the strength of family ties is better in their country of origin (69%) than in the U.S. (8%).
- Compared with other U.S. Asian groups, Indian Americans are the most likely to identify with the Democratic Party; 65% are Democrats or lean to the Democrats, 18% are Republican or lean to the Republicans. And 65% of Indian Americans approve of President Obama’s job performance, while 22% disapprove.
Vietnamese Americans
History
Vietnamese immigration to the U.S. is largely a result of U.S. involvement in the Vietnam War. During and after that war, Vietnamese and other Southeast Asian refugees fled the threat of political persecution and physical danger in their home countries and were resettled in the U.S. as part of an international resettlement effort.
Vietnamese immigration to the U.S. can be divided into four distinct waves. The first left in the early and mid-1970s, including about 130,000 refugees evacuated to the U.S. as a result of the fall of Saigon in 1975. Some were airlifted out in U.S. military helicopters. Most could speak some English, came from urban areas and were economically better off than the population as a whole. The second wave of Vietnamese refugees, who left the country in the late 1970s, was larger, less educated and poorer than the first wave, often leaving without capital or possessions. Many fled by boat and spent months or years in refugee camps before being resettled in the U.S. under sponsorship of churches, social agencies or families.
The third wave of Vietnamese immigrants entered the U.S. after 1980, many under a formal immigration process that resulted from an agreement between Vietnam and the U.S. The fourth wave, which dates from the mid-1990s, includes a growing number of immigrants who arrive under family unification visas—the result of an established community in the U.S.
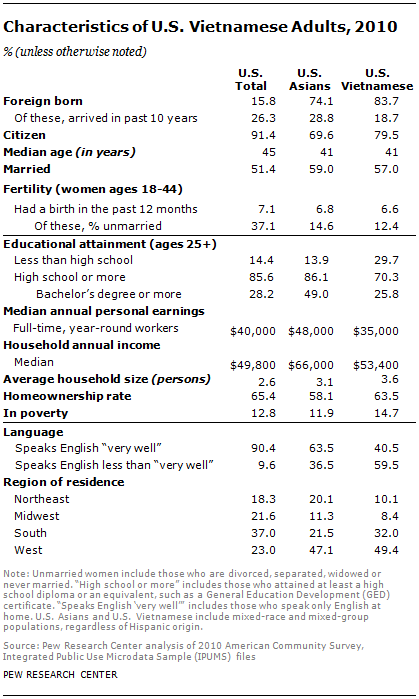
In 2010, an estimated 1.31 million adult Vietnamese Americans were in the U.S., according to the Census Bureau’s American Community Survey. Vietnamese Americans are the fourth-largest group among Asian Americans and represent about 10% of the adult Asian-American population in the U.S.
Characteristics (2010 ACS)
- Nativity and citizenship. More than eight-in-ten (84%) adult Vietnamese Americans in the United States are foreign born, compared with about 74% adult Asian Americans and 16% of the adult U.S. population overall. A majority of Vietnamese adults are U.S. citizens (80%), higher than the share among the overall adult Asian population (70%) and lower than the national share (91%).
- Language. Less than half of Vietnamese Americans (41%) speak English proficiently,42 compared with 63% of all Asian Americans and 90% of the U.S. population overall.
- Age. The median age of adult Vietnamese Americans is 41, the same as for adult Asian Americans (41) and lower than the national median (45).
- Marital status. More than half (57%) of adult Vietnamese Americans are married, a share slightly lower than for Asian Americans overall (59%), but higher than for the nation (51%).
- Fertility. The share of Vietnamese-American women ages 18 to 44 who gave birth in the 12 months before the American Community Survey was 6.6%; this is similar to the comparable share for Asian-American women overall (6.8%) and lower than the national share (7.1%). About 12% of Vietnamese-American women who gave birth in the previous 12 months were unmarried, a lower share than for all comparable Asian-American women (15%) and for all comparable women (37%).
- Educational attainment. Among Vietnamese Americans ages 25 and older, about a quarter (26%) have obtained at least a bachelor’s degree; this is significantly lower than the Asian-American share (49%) and slightly lower than the national share (28%).
- Income. Median annual personal earnings for Vietnamese-American full-time, year-round workers are $35,000, lower than the median earnings for all Asian Americans ($48,000) and all U.S. adults ($40,000). Among households, the median annual income for Vietnamese Americans is $53,400, lower than for all Asian Americans ($66,000) but higher than for all U.S. households ($49,800).
- Homeownership. More than six-in-ten Vietnamese Americans (63%) own a home, compared with 58% of all Asian Americans and 65% of the U.S. population overall.
- Poverty status. The share of adult Vietnamese American who live in poverty is 15%, higher than the shares of Asian Americans in general (12%) and of the U.S. population overall (13%).
- Regional dispersion. Nearly half of adult Vietnamese Americans (49%) live in the West, compared with 47% of Asian Americans and 23% of the U.S. population overall.
Attitudes
Here are a few key findings from the 2012 Asian-American survey about Vietnamese Americans compared with other major U.S. Asian groups:
- Compared with other U.S. Asian groups, Vietnamese Americans are especially likely to see conditions in the U.S. as better than in their country of origin. More than nine-in-ten (94%) of Vietnamese Americans say the opportunity to get ahead is better in the U.S. than in Vietnam; 87% say the freedom to practice one’s religion is better in the U.S.; 86% say treatment of the poor is better in the U.S.; and 84% say conditions for raising children are better in the U.S.
- Among the U.S. Asian groups, Vietnamese Americans are the most upbeat about their children’s futures. Fully 48% expect their children’s standard of living to be much better than theirs is, when their children reach a comparable age.
- Vietnamese Americans are the most likely among U.S. Asian groups to believe in the value of hard work. More than eight-in-ten (83%) agree that most people can get ahead if they work hard, while only 15% say hard work and determination are no guarantee of success for most people.
Korean Americans
History
Early Korean immigrants mostly began their journey to the U.S. in Hawaii. Between 1903 and 1905, more than 7,000 Koreans were recruited for plantation labor work there. Korean immigrants, about 40% of whom were Christians, built many churches in Hawaii.
Korean immigration to the mainland U.S. was sparse through World War II. The arrivals included about a thousand workers who came from Hawaii, about a hundred Korean mail-order “picture brides” and perhaps 900 students, many of whom fled because of their opposition to the Japanese annexation of their nation in 1910.
A relatively small number of Koreans arrived in the U.S. in mid-century as brides of service members in the Korean War, orphans adopted by U.S. couples, or professionals and students.
The majority of the present Korean population in the U.S. came after the 1965 immigration act was implemented. Educational attainment increased in Korea in the 1960s and 1970s, but few job opportunities for skilled workers were available. Skilled professionals moved to U.S. and many other countries. Some immigrants founded small businesses; Koreans have the highest self-employment rate among U.S. Asian groups.
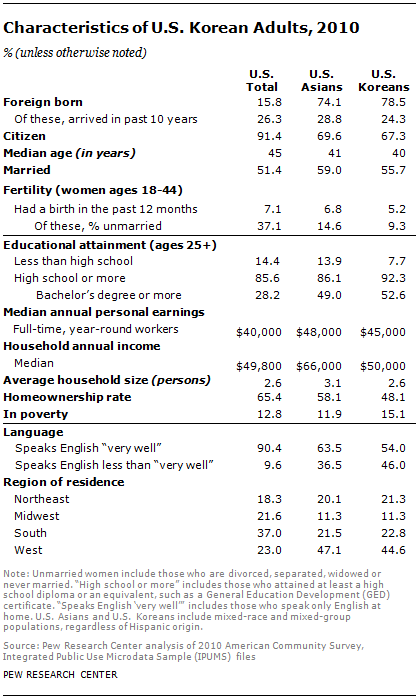
In 2010, an estimated 1.26 million adult Koreans Americans were in the U.S., according to the Census Bureau’s American Community Survey. Koreans are the fifth-largest group among Asian Americans and represent about 10% of the adult Asian population in the U.S.
Characteristics (2010 ACS)
- Nativity and citizenship. Nearly eight-in-ten (79%) adult Korean Americans in the United States are foreign born, compared with 74% of adult Asian Americans and 16% of adults in the U.S. A majority of Korean adults are U.S. citizens (67%), lower than the share among overall adult Asian population (70%) and the national share (91%).
- Language. Slightly more than half of Korean Americans (54%) speak English proficiently,43 compared with 63% of all Asian Americans and 90% of the U.S. population overall.
- Age. The median age of adult Korean Americans is 40, similar to that of all adult Asian Americans (41) and lower than the national median (45).
- Marital status. More than half of adult Korean Americans (56%) are married, a share slightly lower than for all Asian Americans (59%) but higher than the national share (51%).
- Fertility. The share of Korean-American women ages 18 to 44 who gave birth in the 12 months before the 2010 American Community Survey was 5.2%, lower than the comparable share among Asian-American women overall (6.8%) and the national share (7.1%). About 9% of Korean-American women who gave birth in the previous 12 months were unmarried, a share lower than for all comparable Asian-American women (15%) and all comparable U.S. women (37%).
- Educational attainment. Among Korean Americans ages 25 and older, more than half (53%) have obtained at least a bachelor’s degree; this is higher than the Asian-American share (49%) as well as the national share (28%).
- Income. Median annual personal earnings for Korean-American full-time, year-round workers are $45,000, lower than for all Asian Americans ($48,000) but higher than for all U.S. adults ($40,000). Among households, the median annual income for Koreans is $50,000, lower than for all Asians ($66,000) but slightly higher than for the U.S. population ($49,800).
- Homeownership. Close to half of Korean Americans (48%) own a home, compared with 58% of all Asian Americans and 65% of the U.S. population overall.
- Poverty status. The share of adult Korean Americans who live in poverty is 15%, higher than the shares of all Asian Americans (12%) and of the U.S. population overall (13%).
- Regional dispersion. More than four-in-ten (45%) adult Korean Americans live in the West, compared with 47% of Asian Americans and 23% of the U.S. population overall.
Attitudes
Here are a few key findings from the 2012 Asian-American survey about Korean Americans compared with other major U.S. Asian groups:
- Across U.S. Asian groups, Korean Americans seem to be more strongly connected to their intra-ethnic communities. They are the most likely to say that all or most of their friends share the same ethnic heritage (58%).
- Compared with other U.S. Asian groups, Korean Americans are among the most likely to say that it is very important to them that future generations of Koreans living in the U.S. speak their ancestral language (62%).
- Korean Americans are more likely than U.S. Asians from other groups to say that parents from their country of origin put too much academic pressure on their children (60%); only 30% say Korean American parents put the right amount of pressure on their children; and 5% say they do not put enough pressure on children.
- Korean Americans stand out for their negative views on their group’s relations with blacks. Fully half say these two groups don’t get along well; while 39% say they get along pretty well and just 4% say they get along very well.
Japanese Americans
History
Japanese immigrants first came to Hawaii in the 19th century and became plantation workers; they did not come in large numbers to the United States until the 1890s. After the Chinese Exclusion Act of 1882, Japanese immigrants were sought by industrialists to replace Chinese immigrants who were barred from entry. In 1890, only about 2,000 Japanese lived on the U.S. mainland, but by 1910, the Japanese-American population of more than 72,000 exceeded the number of Chinese Americans.
In contrast to its policy toward Chinese immigrants, the U.S. government allowed immigration of Japanese women (as spouses) into the U.S., because of the “Gentlemen’s Agreement” between President Theodore Roosevelt and the Japanese government in 1907. This allowed many Japanese Americans to start families and establish stable communities.
After Japan’s attack of Pearl Harbor in December 1941 that triggered the U.S. declaration of war against Japan and entry into World War II, the FBI arrested thousands of Japanese Americans who were considered potential security threats. An estimated 120,000 Japanese Americans were relocated and placed in internment camps by the U.S. government. In many cases, interned Japanese-American families lost their land.
Japanese Americans were the largest Asian-American group from 1910 to 1960. Unlike other Asian immigrant groups during those years, much of the population lived in family groups so grew through births. Relatively few Japanese entered the U.S. after the major overhaul of immigration laws in 1965, in part because there were fewer factors (such as lack of jobs in their home country) to push them out.
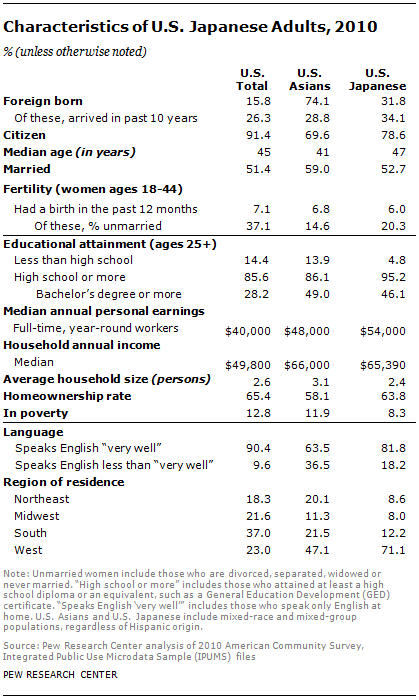
In 2010, an estimated 900,000 adult Japanese Americans were in the U.S., according to the Census Bureau’s American Community Survey. Japanese Americans are the sixth-largest Asian-American group and represent about 7% of the adult Asian population in the U.S.
Characteristics (2010 ACS)
- Nativity and citizenship. Nearly a third (32%) of adult Japanese Americans in the United States are foreign born, compared with 74% of adult Asian Americans and 16% of the adult U.S. population overall. A majority of Japanese adults are U.S. citizens (79%), higher than the share among overall adult Asian population (70%) and lower than the national share (91%).
- Language. A substantial majority of Japanese Americans (82%) speak English proficiently,44 compared with 63% of all Asian Americans and 90% of the U.S. population overall.
- Age. The median age of adult Japanese Americans is 47, higher than for all adult Asian Americans (41) and the national median (45).
- Marital status. Slightly more than half of adult Japanese Americans (53%) are married, a share lower than for all Asian Americans (59%) but slightly higher than for the nation (51%).
- Fertility. The share of Japanese-American women ages 18 to 44 who gave birth in the 12 months prior to the American Community Survey was 6.0%; this is lower than the comparable share among Asian-American women overall (6.8%) and the national share (7.1%). About 20% of Japanese-American women who gave birth in the previous 12 months were unmarried, a higher share than for all comparable Asian-American women (15%) but lower than the national share (37%).
- Educational attainment. Among Japanese Americans ages 25 and older, more than four-in-ten (46%) have obtained at least a bachelor’s degree. This is slightly lower than the Asian-American share (49%) and significantly higher than the national share (28%).
- Income. Median annual personal earnings for Japanese-American full-time, year-round workers are $54,000, higher than for all Asian Americans ($48,000) and for all U.S. adults ($40,000). Among households, the median annual income for Japanese Americans is $65,390, slightly lower than for all Asian-American households ($66,000) but higher than for all U.S. households ($49,800).
- Homeownership. More than six-in-ten Japanese Americans (64%) own a home, compared with 58% of all Asian Americans and 65% of the U.S. population overall.
- Poverty status. The share of adult Japanese Americans who live in poverty is 8%, lower than the shares of all Asian Americans (12%) and of the U.S. population overall (13%).
- Regional dispersion. Japanese Americans are highly concentrated in the Western states. More than seven-in-ten (71%) adult Japanese Americans live in the West, compared with 47% of Asian Americans and 23% of the U.S. population overall.
Attitudes
Here are a few key findings from the 2012 Asian-American survey about Japanese Americans compared with other major U.S. Asian groups:
- Compared with other U.S. Asian groups, Japanese Americans are among the most comfortable with intergroup marriage: 71% of Japanese Americans say they would be “very comfortable” if their child married someone from another country of origin group, and 67% would be “very comfortable” if their child married a non-Asian. In addition, among Asian newlyweds, Japanese Americans have the highest rate of intermarriage.
- Japanese Americans are more accepting of homosexuality than U.S. Asians from most other groups; 68% of Japanese Americans say homosexuality should be accepted by society; 22% say it should be discouraged. They also are among the most supportive of legal abortion: 68% of Japanese Americans say abortion should be legal in all or most cases; 20% say it should be illegal in all or most cases.
- Across U.S. Asian groups, Japanese Americans are among the most likely to say parents from their own country of origin put about the right amount of pressure on their children to do well in school. Six-in-ten (60%) Japanese Americans say parents from their group take the right approach with their children, 25% say they put too much pressure and 7% say they do not put enough pressure on children to do well in school.
Other Asian Americans
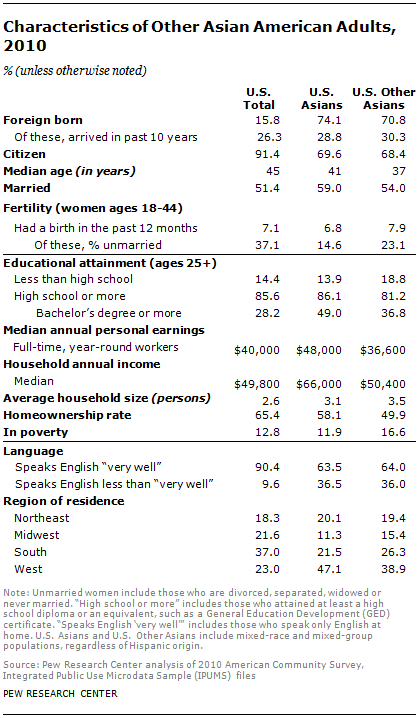
Asian Americans are a diverse group, and they differ in language, culture, and length of residence in the U.S. In addition to the six major Asian groups (each with overall population more than 1 million), there are numerous other smaller Asian groups. Together, they represent 1.9 million adults.
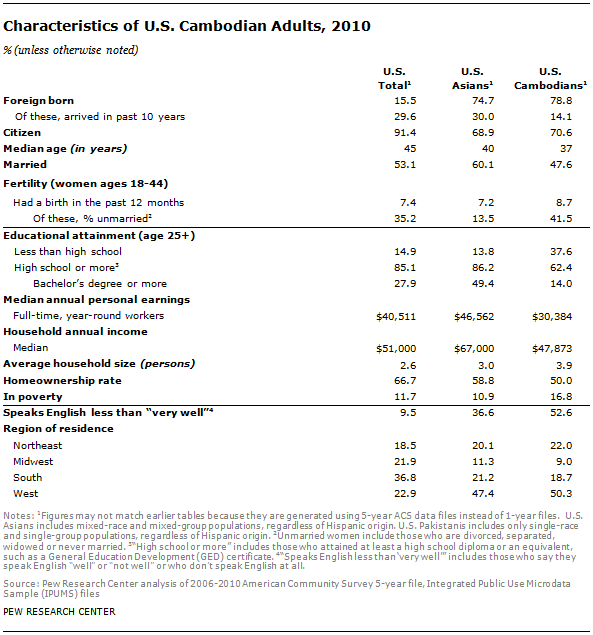
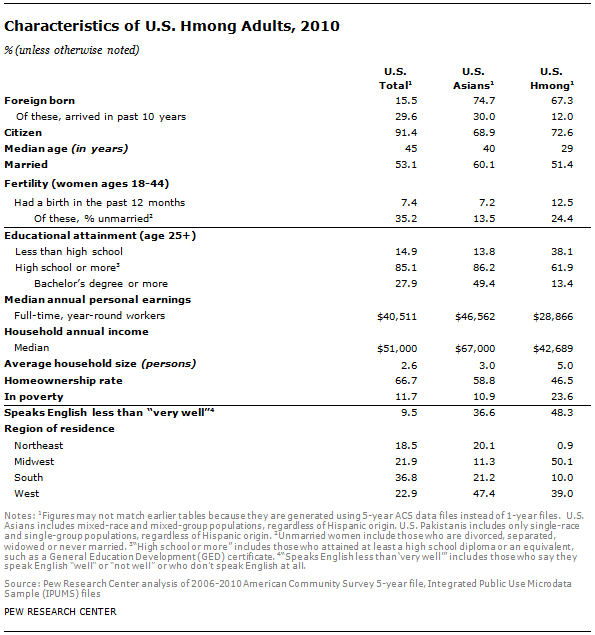
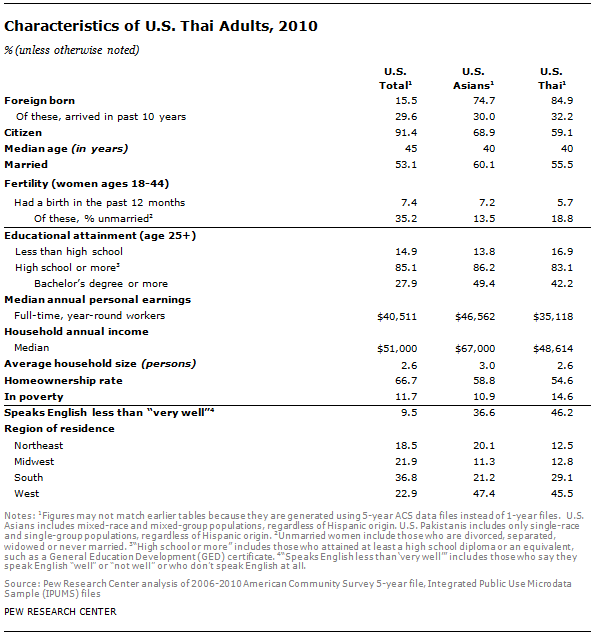
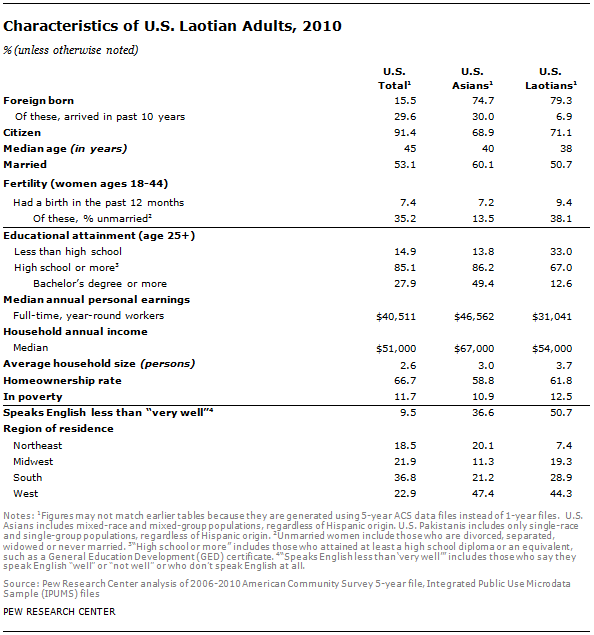
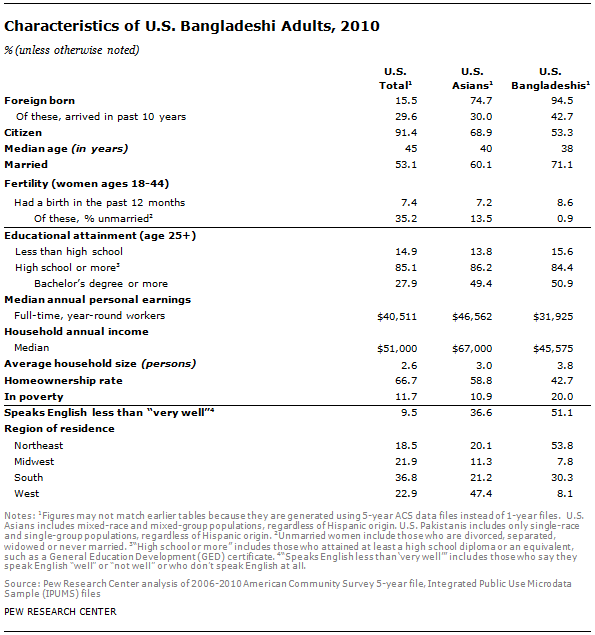
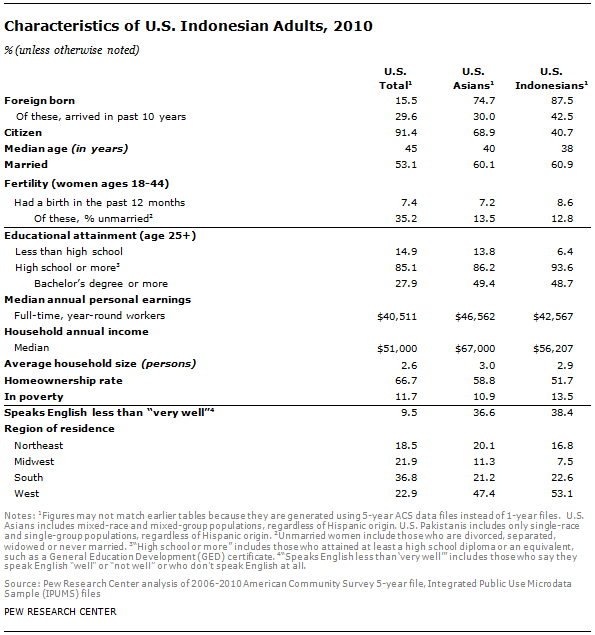
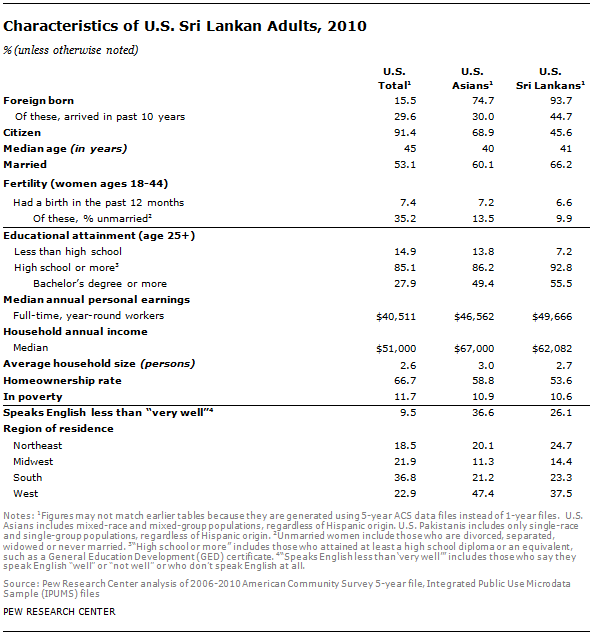
Looking at the total population, including children, the 2010 Census counted seven additional Asian groups that each include more than 100,000 people. They are Bangladeshis, Burmese, Cambodians, Hmong, Laotians, Pakistanis and Thais. (Another group, Indonesians, numbered 95,000 in the 2010 Census.)
Although variation exists among these subgroups, as a combined population other Asians are somewhat younger and less well off than other Asian Americans. The share in poverty—nearly 17%—is markedly higher than for all Asians.
Their median age is 37, compared with 41 for all Asian Americans. Their personal earnings, median household income and homeownership rate are lower than for all Asian Americans; their likelihood of poverty and unemployment is higher. However, their citizenship and English proficiency rates are similar.
Additional Tables
I. Trend for Overall and Foreign-born Asian Population, 1980-2010
II. Education Characteristics of Recent Immigrants
III. Native- vs. Foreign-born Asian Americans
IV. Employment and Family Structure
V. Characteristics of Smaller U.S. Asian Subgroups, 201045