Residential segregation by income has increased during the past three decades across the United States and in 27 of the nation’s 30 largest major metropolitan areas1 , according to a new analysis of census tract2 and household income data by the Pew Research Center.
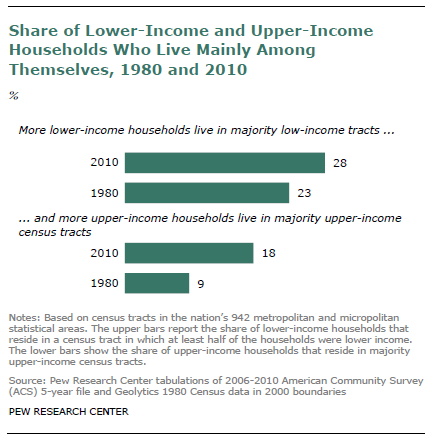
The analysis finds that 28% of lower-income households in 2010 were located in a majority lower-income census tract, up from 23% in 1980, and that 18% of upper- income households were located in a majority upper-income census tract, up from 9% in 1980.3
These increases are related to the long-term rise in income inequality, which has led to a shrinkage in the share of neighborhoods across the United States that are predominantly middle class or mixed income—to 76% in 2010, down from 85% in 1980—and a rise in the shares that are majority lower income (18% in 2010, up from 12% in 1980) and majority upper income (6% in 2010, up from 3% in 1980).

Despite the long-term rise in residential segregation by income, it remains less pervasive than residential segregation by race, even though black-white segregation has been falling for several decades.
The Pew Research analysis also finds significant differences among the nation’s 10 most populous metropolitan areas in the patterns and degree of residential segregation by income. For example, 41% of the lower-income households in the New York metropolitan area are situated in a majority lower-income census tract, compared with 26% of the lower-income households in the Atlanta area.
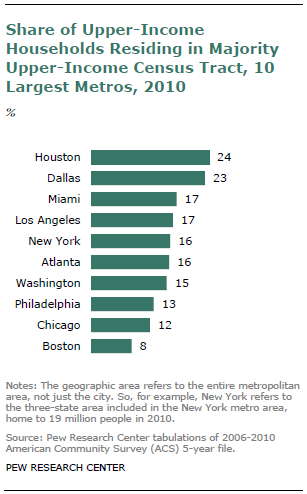
As for residential concentration among upper-income households, here, too, there are variations across the 10 largest metro areas, but the patterns and rankings are different. On this measure, Houston and Dallas sit atop the chart, with 24% and 23%, respectively, of their upper-income households situated in a census tract in which a majority of all households are also upper income. (And when the universe of analysis is expanded to include the nation’s 30 largest metropolitan areas, another Texas metro area, San Antonio, joins those two atop the chart, with 25%.)
By contrast, just 8% of the upper-income households in the Boston metropolitan area are located in a majority upper-income tract, as are 12% in Chicago and 13% in Philadelphia.
The RISI Score
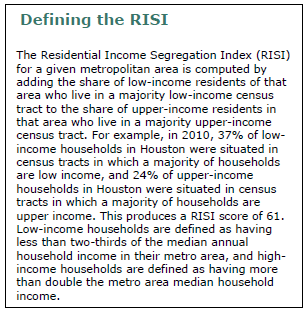
By adding together the share of lower-income households living in a majority lower-income tract and the share of upper-income households living in a majority upper-income tract, this Pew Research analysis has developed a single Residential Income Segregation Index (RISI) score for each of the nation’s top 30 metropolitan areas.
(The maximum possible RISI score is 200. In such a metropolitan area, 100% of lower-income and 100% of upper-income households would be situated in a census tract where a majority of households were in their same income bracket.)
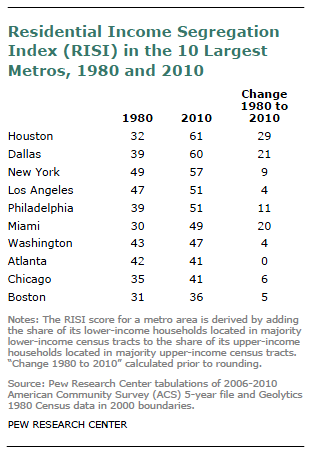
Among the nation’s 10 largest metro areas, Houston (61) and Dallas (60) have the highest RISI scores, followed closely by New York (57). At the other end of the scale, Boston (36), Chicago (41) and Atlanta (41) have the lowest RISI scores among the nation’s 10 largest metro areas.
It is beyond the scope of this report to analyze in any detail the causes of these metro area differences. Among the factors that may play a role are historical settlement patterns; local housing policies, zoning laws, real estate practices and migration trends; and the characteristics of the local economy and workforce.
Two broad patterns seem worthy of note. First, in looking at the changes over time in the nation’s top 30 metropolitan areas, one finds that most of the metros whose RISI scores have had the largest increases have also experienced significant population growth fueled by in-migration.
For example, Houston, Dallas, San Antonio, Phoenix and Miami have all been among the nation’s fastest-growing large metropolitan areas during the past three decades—a growth that has been fueled in part by an influx of low-skill, low-wage immigrants from south of the border and in part by an influx of high-skill, high-wage workers and well-to-do retirees. These dual migration streams could well have contributed to a rise in residential segregation by income.
However, not all fast-growing metropolitan areas conform to this pattern. Among the 10 largest metros, Atlanta is the main outlier. It has a low RISI score (41) that is virtually unchanged from 30 years ago (42), but during this period it led all of the top 10 metros in its population growth (168%).4
Meantime, at the other end of the RISI scale for the top 10 metro areas, the Boston and Chicago metropolitan areas have experienced more modest population growth from 1980 to 2010, with an increase during that period of 56% in Boston and just 17% in Chicago. The RISI scores in both of these metro areas have risen only modestly from 1980 to 2010.
Regional Patterns
The other noteworthy pattern is regional. Looking at the nation’s 30 largest metro areas (see the table on page 6), one finds that the metro areas in the Southwest have the highest average RISI score (57), followed by those in the Northeast (48), Midwest (44), West (38) and Southeast (35). The analysis also shows that the level of residential segregation by income in the big Southwestern metro areas have, on average, increased much more rapidly from 1980 to 2010 than have those in other parts of the country. But all regions have had some increase.
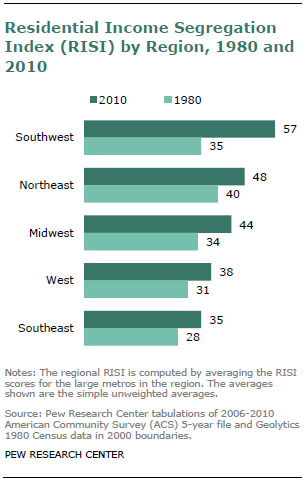
Here is a brief summary of the regional patterns. In each case, the cities are the ones from that region that are in the top 30 metro areas. The numbers following each metro area are its 2010 and 1980 RISI scores, respectively:
Southwest. 2010 RISI average: 57; 1980 RISI average: 35. San Antonio (63/39), Houston (61/32), Dallas (60/39), Denver (55/34) and Phoenix (48/33).
Northeast. 2010 RISI average: 48; 1980 RISI average: 40. New York (57/49), Philadelphia (51/39), Baltimore (48/36), Washington (47/43) and Boston (36/31).
Midwest. 2010 RISI average: 44; 1980 RISI average: 34. Detroit (54/43), Columbus, OH (53/37), Kansas City (47/38), Cincinnati (47/31), Cleveland (46/34), Chicago (41/35), Pittsburgh (38/25), St. Louis (38/34) and Minneapolis (28/29).
West. 2010 RISI average: 38; 1980 RISI average: 31. Los Angeles (51/47), San Francisco (43/38), San Diego (40/34), Riverside (38/28), Sacramento (35/24), Seattle (34/27) and Portland (25/19).
Southeast. 2010 RISI average: 35; 1980 RISI average: 28. Miami (49/30), Atlanta (41/42), Tampa (29/19) and Orlando (22/23).

About this Report
This report describes trends over time in the household income composition of America’s neighborhoods or census tracts. The focus is on the tract characteristics of lower-income households, middle-income households and upper-income households.
Households are classified as lower, middle, or upper income on the basis of the household’s income compared to the median household income. Households with an income between two-thirds and twice the median household income were classified as middle income.
At the tract level, data are available for household income only without adjustment for the size of the household, so the entire report is based on unadjusted household income data.
The tract level data for 2010 is from the Census Bureau’s 2010 American Community Survey (ACS) five-year file. Comparable data for 2000, 1990 and 1980 are in the SF3 files of the respective decennial censuses.
See the appendix for additional details on data sources and methodology.
The report was edited and the overview written by Paul Taylor, executive vice president of the Pew Research Center and director of its Social & Demographic Trends project. Senior economist Richard Fry researched and wrote the report. Research assistant Eileen Patten helped with the preparation of charts and formatting the report. The report was number-checked by Patten and Pew Research Center intern Antonio Rodriguez. The report was copy-edited by Marcia Kramer. The authors are grateful for the contributions of senior demographer Jeffrey S. Passel in interpolating the tract-level household income data. The Center appreciates the comments of outside reviewers John Logan of Brown University and William Frey of the Brookings Institution on an earlier draft.


