Overview
This chapter examines trends in the well-being of lower-, middle- and upper-income groups through the prisms of income and wealth.38 Income is the more widely used measure, but, due to changing economic circumstances, it is subject to sharp, short-term fluctuations. A family that is considered in the middle-income group one year may be in the lower-income group the next, or vice versa.39
Wealth, unlike income, represents a stock of assets, minus outstanding debt, accumulated over time. Among other things, wealth provides retirement income, protection against short-term economic shocks, and security and social status for future generations. There are families, such as seniors who are retired, with low incomes but high levels of wealth, and other families, such as young professionals, with high incomes and low levels of wealth. Thus, the two yardsticks together provide a more complete portrait of the economic status of families.
Trends in income for lower-, middle- and upper-tier households show that in the past four decades the United States has been a society characterized by rising prosperity and rising inequality. Income rose for all three tiers, but it increased the most for the upper-income tier and the least for the lower-income tier. As a result, upper-income households accounted for a larger share of U.S. aggregate household income in 2010 than they did in 1970.40 The increase in their share of aggregate income exceeded the increase in the share of adults that live in upper-income households.
Trends in wealth, data for which are available starting in 1983, tell a slightly different story. From 1983 to 2010, there was a notable increase in wealth only for the upper-income tier. The incomes of middle- and lower-income households may have increased, but their net worth has stagnated and their long-term security may not be as secure as suggested by the trends in income.41 Moreover, the growth in the wealth gap across income tiers easily outdistances the growth in the income gap.
The disparate trends in income and wealth emerged in the Great Recession. The recession caused income to fall by similar percentages in all three income tiers. However, the loss in wealth was much sharper for the lower- and middle-income tiers. Those setbacks were large enough to turn the clock back on the net worth of lower- and middle-income households by about two decades or more.
The steep decline in the net worth of lower- and middle-income households is a consequence of the housing boom and bust that preceded the Great Recession. These households are twice as dependent as upper-income households are on home equity as a source of wealth. Furthermore, in the run-up to the recession, they took on relatively more debt in relation to their assets than did upper-income families. Much of that new debt was secured by their primary residence. Thus, lower- and middle-income families were more vulnerable to the crash in housing values that preceded the recession.42
As in preceding chapters, the estimates of income reported below have been adjusted for household size and scaled to reflect a three-person household. However, wealth data are not adjusted for family size because it is difficult to associate a current family size with a stock of wealth. In part, that is because wealth is accumulated and “consumed” over an extended period of time during which family structure may change significantly. It is also typical for at least part of a family’s wealth to be passed on for the benefit of future generations.
The income analysis spans the 1970-2010 period and is based on the Current Population Survey. Dictated by the availability of data, the wealth trends are measured from 1983 to 2010 using the Survey of Consumer Finances. Because of the way the data are collected and reported, the unit of analysis for income is the household and the unit of analysis for wealth is the family. Families, or households, are divided into three groups based on their income level after the income has been adjusted for differences in family or household size. This process is conducted independently for the two data sources.
Major findings include:
Income
- The median income of all U.S. households increased from $44,845 in 1970 to $63,277 in 2000, an increase of 41% (incomes in 2011 dollars). But that proved to be the peak. By 2010, the median income had fallen to $59,127, a loss of 7%.
- Household income for all three tiers—lower, middle and upper—also peaked at the turn of the century and then reversed course. From 2000 to 2010, the median income of lower-income households fell 8%, middle-income households lost 5%, and upper-income households surrendered 6%.
- From 1970 to 2010, the median income of middle-income households increased from $51,932 to $69,487, or by 34%. The median income of lower-income households rose from $17,853 to $23,063, or 29%. The median income of households in the upper tier increased the most (43%), from $112,651 in 1970 to $161,252 in 2010.
- The income gap across the three tiers narrowed in the 1970s, with the incomes of lower- and middle-income households increasing at the fastest rate. However, the income gap widened in the 1980s as incomes of households in the upper tier increased at more than double the rate of lower-income households. The gap has grown at a slower pace in the past two decades.
- The share of U.S. aggregate household income accounted for by upper-income households increased from 29% in 1970 to 46% in 2010. The share accounted for by middle-income households fell from 62% in 1970 to 45% in 2010. The share of lower-income households was unchanged at about 9%.
Wealth
- The median wealth of all U.S. families, in 2011 dollars, increased from $73,972 in 1983 to $131,016 in 2007, a gain of 77%. However, the Great Recession eliminated almost all of this gain as median wealth plunged to $79,431 in 2010, a loss of 39%. Overall, median net worth in 2010 was 7% higher than in 1983.
- In percentage terms, the loss in wealth from 2007 to 2010 was the greatest for lower- and middle-income families. Since the recession started, net worth fell 41% for lower-income families, 39% for middle-income families, and 17% for upper-income families.
- From 1983 to 2010, net worth has increased by a significant amount only for upper-income families. Their median wealth rose from $307,134 in 1983 to $574,788 in 2010, or by 87%. The median wealth of middle-income families increased from $91,056 to $93,150, or by 2%. The median wealth of lower-income families decreased 7%, from $10,963 in 1983 to $10,151 in 2010.
- There has been a sharp rise in the wealth gap and this has mostly occurred since 2001. The wealth of upper-income families was three times the wealth of middle-income families in 1983 and four times as high in 2001. By 2011, this ratio had risen to six-to-one. The ratio of the wealth of upper-income families to the wealth of lower-income families was 28-to-1 in 1983, 31-to-1 in 2001 and 57-to-1 in 2010.
- Middle- and lower-income families derive about 45% of their net worth from equity in their homes. Upper-income families have more diversified portfolios, with three major groups of assets—housing, businesses and stocks—each contributing 20% to 25% to their total net worth.
- Families in all three income tiers took on more debt from 1983 and 2007. But the growth in mean debt levels was highest for lower-income families (215%) and middle-income families (206%). The mean debt level for upper-income families increased by 122% over this period. From 2007 to 2010, mean debt levels retreated for upper-income families (down 6%) and middle-income families (down 11%) but not for lower-income families (up 15%).
Trends in the Income of Lower-, Middle- and Upper-Income Tiers

The median real income of U.S. households has increased markedly since 1970. In 2010, the median household income in the U.S. was $59,127 (expressed in 2011 dollars and adjusted for household size). That was 32% higher than the median income of U.S. households in 1970 ($44,845).
The increase in household income was remarkably steady from 1970 to 2000, increasing 12% each in the 1970s, the 1980s and the 1990s. However, the median household income in 2010 was less than in 2000, falling from $63,277 in 2000 to $59,127 in 2010, or a drop of nearly 7%. That is the lingering aftermath of the 2001 recession, an economic slowdown that persisted through 2003 and the Great Recession of 2007-2009.
The overall gains in income were shared by households in all three income tiers, albeit not equally. For middle-income households, the median income increased from $51,932 in 1970 to $69,487 in 2010, a gain of 34%. Over this period, the median income of lower-income households increased from $17,853 to $23,063, or by 29%. For upper-income households, the median income rose 43%, from $112,651 in 1970 to $161,252 in 2010.
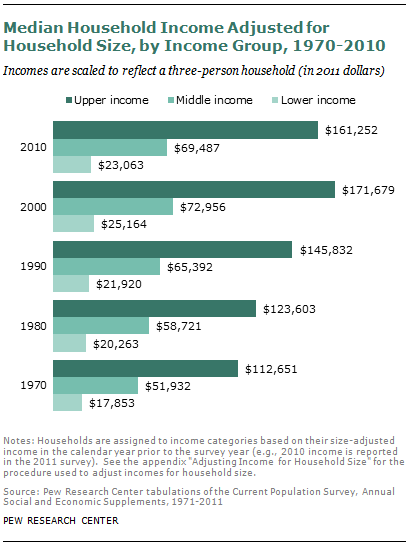
Households in all three income tiers lost ground from 2000 to 2010. The median income for middle-income households fell from $72,956 to $69,487; the median for lower-income households dropped from $25,164 to $23,063; and the median income for upper-income households slid from $171,679 to $161,252.
The overall trend in income growth masks some differences across the decades and income groups. In the 1970s, income growth was the strongest for lower- and middle-income households (13% each). Incomes for upper-income households increased 10% in the 1970s.
The pattern reversed in the 1980s with the strongest gains (18%) experienced by upper-income households. That was significantly greater than the 11% growth in the median income of middle-income households. It also was more than double the increase of 8% for lower-income households. This decade marked the beginning of a widening of the income gap.
Lower-income households were among the greatest beneficiaries of the economic expansion in the 1990s. Their median income in the 1990s increased by 15%, almost double the rate of increase in the previous decade. The growth in the incomes of middle-income households (12%) and upper-income households (18%) were virtually unchanged from the 1980s.

In the “lost decade,” 2000 to 2010, previous gains in incomes for all three tiers of households eroded. In this decade, the median income of lower-income households decreased 8%, the income of middle-income households fell 5%, and the median income for upper-income households dropped 6%.
Distribution of U.S. Aggregate Household Income
The distribution of U.S. aggregate household income shifted away from the middle and lower tiers to the upper-income tier from 1970 to 2010. This is the consequence of two trends: the higher rate of growth in the incomes of upper-tier households and the decreasing share of adults who live in middle-income households.
In 2010, upper-income households accounted for 46% of U.S. aggregate household income.43 Their share in aggregate income was more than double the share of adults (20%) living in those households. Middle-income households accounted for 45% of U.S. aggregate household income in 2010, less than the share of adults (51%) living in those households. Lower-income
households had a 29% share in the adult population but accounted for only 9% of aggregate income.

In 1970, upper-income households accounted for 29% of aggregate income, middle-income households had a 62% share, and lower-income households accounted for 10% of aggregate income. For the middle, the share in income was about the same as the share in the adult population in 1970 (61%). Upper-income households accounted for 14% of the adult population in 1970, and lower-income households accounted for 25%.
From 1970 to 2010, the share of middle-income households in aggregate income fell more sharply (by 27%) than its share in the adult population (down 16%). In contrast, the share of upper-income households in aggregate income rose faster (by 60%) than its share in the adult population (up 44%). For lower-income households, the share in aggregate income fell moderately (6%), despite a 15% increase in their share of the adult population.
The net result of the trends in household incomes and the distribution of the adult population is a more uneven distribution of aggregate income in 2010 than what it was in 1970.44 The shift in the distribution is most pronounced in the 1980s and the 1990s. Those are the two decades in which income growth was more pronounced for upper-income households compared with the growth in the incomes of middle- and lower-income households.
Trends in the Wealth of Lower-, Middle- and Upper-Income Tiers
Based on wealth, the distances between lower-, middle- and upper-income families are much greater than the differences in income. Moreover, the wealth gap has increased by much more than the income gap in the past three decades. The most striking finding is that only upper-income families have experienced notable gains in wealth from 1983 to 2010; the net worth of lower- and middle-income families is virtually unchanged. This is a consequence of the housing market crash in 2006 and the Great Recession, which have seemingly erased nearly all of the wealth gains experienced by lower- and middle-income families in the two decades prior to the start of the Great Recession.
Because the Survey of Consumer Finances, the source for wealth data, is conducted triennially, estimates presented in this section cover nine-year intervals starting with 1983.45 The years 1983, 1992, 2001 and 2010 follow immediately on the heels of or represent the tail ends of recessions. Data are also presented for 2007, a business cycle peak, to highlight the impact of the Great Recession on the wealth of U.S. households.
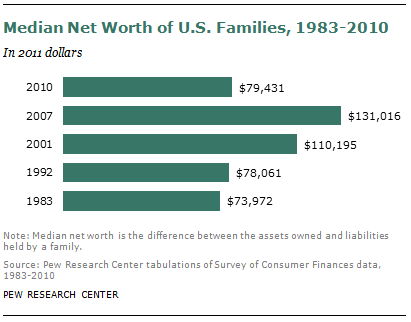
In 1983, the median wealth of American families was $73,972 (expressed in 2011 dollars). It increased slowly in the 1980s, reaching $78,061 in 1992 for a gain of 6%. The 1990s delivered much greater gains in wealth as it climbed up by 41% to $110,195 in 2001. The housing boom that characterized the first half of the “lost decade” delivered additional large gains. By 2007, median wealth had reached $131,016, 19% higher than in 2001.
The Great Recession delivered a crushing blow to household wealth. In the space of three years, median wealth fell by 39%, to $79,431 in 2010. Thus, at the end of the last decade, the median net worth of American families was only 7% higher than what it was in 1983.
As one might expect, families’ wealth is strongly correlated with their income. In 1983, the median wealth of middle-income families was $91,056. This was much higher than the wealth of lower-income families—$10,963—but it was less than one-third the wealth of upper-income families—$307,134.
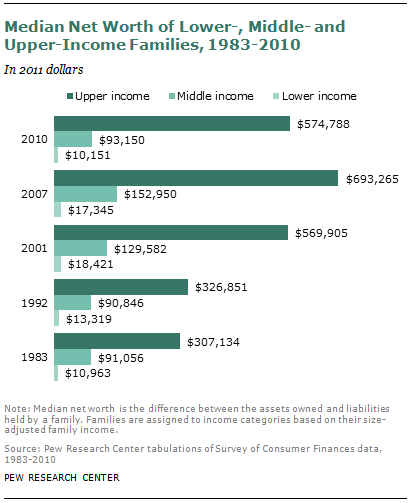
The wealth of middle-income families was unchanged from 1983 to 1992, staying rooted around $91,000. In percentage terms, the wealth of lower-income families rose the most in this period. Their wealth increased to $13,319, or by 21%. The gain for upper-income families was relatively modest, an increase of 6%, to $326,851. The wealth gap across lower- and upper-income families narrowed in this decade, and the gap between middle- and upper-income families widened somewhat from 1983 to 1992.
The wealth of all families rose sharply from 1992 to 2001, with upper-income families experiencing the largest gains. Among middle-income families, median net worth rose from $90,846 in 1992 to $129,582 in 2001, or 43%. Gains for lower-income families were similar, as their median wealth increased by 38%, from $13,319 in 1992 to $18,421 in 2001. The wealth of upper-income families rose 74% in the 1990s, from $326,851 in 1992 to $569,905 in 2001.

The advantage of upper-income families continued to stretch from 2001 to 2007. For them, wealth increased an additional 22% to stand at $693,265 in 2007. The wealth of middle-income families increased almost as much, from $129,582 in 2001 to $152,950, a gain of 18%. However, in the midst of the general gains, lower-income families slipped down the ladder. Their wealth fell from $18,421 in 2001 to $17,345 in 2007, a loss of 6%.
The Great Recession rewound the clock on household wealth accumulation by many years. For middle- and lower-income families, the clock has turned back by about two decades. Their wealth in 2010, $93,150 for the middle-income tier and $10,151 for the lower-income tier, resembles the levels from the 1980s.46 For upper-income families, the journey goes back “only” a decade. Their median wealth in 2010—$574,788—is about the same as their wealth in 2001.
Over the entire 1983 to 2010 period, only upper-income families experienced strong gains in wealth. The wealth of upper-income families increased 87% from 1983 to 2010, but it
increased only 2% for middle-income families and fell 7% for lower-income families. Thus, with respect to wealth, lower- and middle-income families have lost significant ground to upper-income families since 1983. In 1983, the net worth of upper-income families was 3.4 times the net worth of middle-income families. By 2010, that ratio had nearly doubled to 6.2. The ratio of the wealth of upper-income families to the wealth of lower-income families did double, rising from 28.0 in 1983 to 56.6 in 2010. The lion’s share of the increase in these ratios belongs to the “lost decade.”
The Composition of Assets
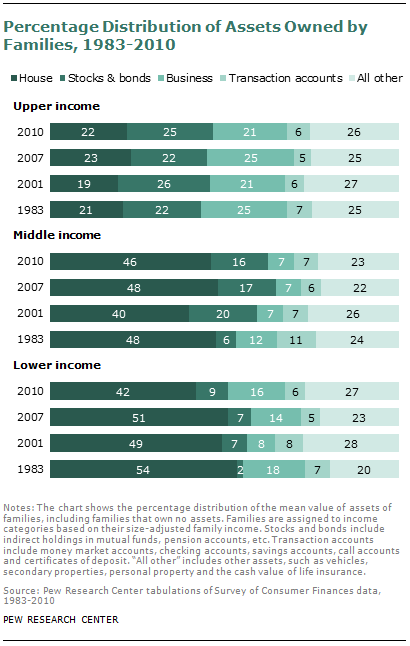
In addition to differences in their level of wealth, lower-, middle- and upper-income families differ in the composition of their portfolios. Generally speaking, the higher a family’s wealth and income, the more diverse its portfolio. For middle- and lower-income families, one asset stands out from the rest: their home. Among upper-income families, houses, stocks and bonds and business assets are equally important.
For lower- and middle-income families, equity in their home accounted for about 40% to 55% of the total mean value of assets in all time periods. Recently, stocks and bonds (including those owned in pension accounts) account for 15% to 20% of assets of middle-income families. Business assets account for about 15% of the portfolio of lower-income families in recent years, about double the share of business assets in the portfolios of middle-income families. For both middle- and lower-income families, a potpourri of other assets—such as vehicles, personal property and secondary properties—are the second most important component of wealth in all years.
The portfolios of upper-income families are more balanced. Houses, stocks and bonds, and business assets each account for 20% to 25% of total assets. Thus, their wealth is less dependent on home equity, the main source of wealth declines since 2006.
Overall, the asset distributions of families did not change much from 1983 to 2010. The most notable change is the growing role of stocks and bonds in middle- and lower-income family portfolios. This change occurred primarily from 1983 to 2001 with the rise of defined contribution pension plans such as 401(k) plans.
Net Worth, Assets and Liabilities
A family’s net worth is the difference between the value of its assets and the value of its liabilities. Net worth will increase as long as the value of a family’s assets, in absolute amount, increases by more than its liabilities. Thus, a family can take on more debt but still increase its net worth as long as its assets holdings increase by a sufficient amount. This section presents trends in the mean net worth, assets and liabilities of lower-, middle- and upper-income families.47 There are notable differences across income groups in this regard, especially with respect to changes in the level of debt.
From 1983 to 2001, the value of the assets owned by families in all three income tiers increased by more than the level of debt. Middle-income families, for example, experienced a gain of $149,035 in the mean value of their assets. In the same period, the value of their debt increased by $30,142. The net gain, or the increase in their mean wealth, was $118,894. The pattern of asset values increasing more than debt values repeated from 2001 to 2007.
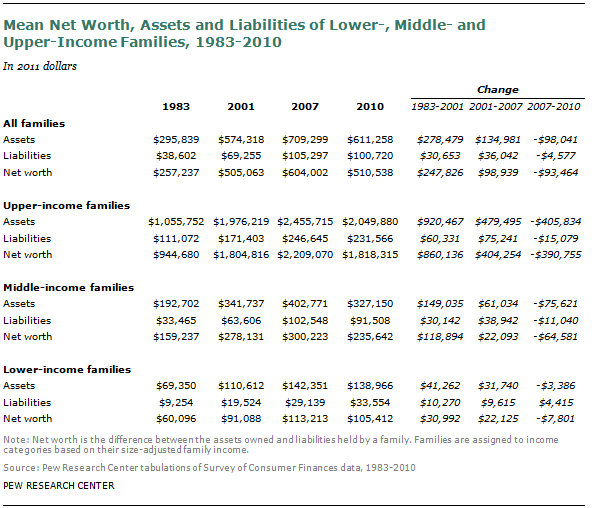
However, even as lower- and middle-income families were accumulating wealth, their debt levels were rising at a faster rate than the values of their assets. From 1983 to 2001, middle-income family debt increased by 90% and asset values increased by 77%. Among lower-income families, debt increased by 111% from 1983 to 2001 and asset values rose by 59%. Only upper-income families experienced a greater increase in the value of their assets (87%) than in their level of debt (54%).
From 2001 to 2007, the pattern of debt rising at a faster pace than asset values became entrenched among upper-income families as well. A principal cause of this was the boom in housing values, which encouraged families to raise the level of debt secured by their primary residences.48 This trend left families in a more vulnerable position prior to the Great Recession than they might have been if the growth in debt and assets had been more balanced.

The story from 2007 to 2010 is mostly one of declining asset values and declining debt levels. The mean debt level for middle-income families fell by $11,040, a cut of 11%. The value of their assets fell even more, by $75,621 (19%). Thus, their mean net worth dropped by $64,581 with the Great Recession. Upper-income families had a similar experience from 2007 to 2010, with their asset values decreasing at a faster rate than their debt levels. Their mean net worth decreased by $390,755 in this period.
Lower-income families experienced a relatively modest loss of 2% in asset values from 2007 to 2010. However, their level of debt increased by $4,415 (15%) during this period. Thus, their net worth fell by $7,801 with the recession.
Overall, from 1983 to 2007, the amount of debt held by families in all income tiers rose significantly. The total increase in mean debt was $19,885 (215%) for lower-income families, $69,083 (206%) for middle-income families, and $135,572 (122%) for upper-income families. The reduction in debt levels from 2007 to 2010 among middle- and upper-income families has not been enough to repair the damage to their portfolios caused by the Great Recession.
References for Chapters 6 and 7
Bricker, Jesse, Arthur B. Kennickell, Kevin B. Moore, and John Sabelhaus. 2012. “Changes in U.S. Family Finances from 2007 to 2010: Evidence from the Survey of Consumer Finances.” Bulletin 98-2. Washington, DC: Federal Reserve, June.
Burkhauser, Richard V., Amy Crews Cutts, Mary C. Daly, and Stephen P. Jenkins. 1999. “Testing the Significance of Income Distribution Changes over the 1980s Business Cycle: A Cross-National Comparison.” Journal of Applied Econometrics 14(3): 253-272.
Burkhauser, Richard V., Jeff Larrimore, and Kosali I. Simon. 2011. “A ‘Second Opinion’ on the Economic Health of the American Middle Class.” Working Paper 17164. Cambridge, MA: National Bureau of Economic Research, June.
Congressional Budget Office. 2011. “Trends in the Distribution of Household Income Between 1979 and 2007.” Washington,
Congressional Budget Office. 2007. “Trends in Earnings Variability Over the Past 20 Years.” Washington, DC: April.
DeNavas-Walt, Carmen, Bernadette D. Proctor, and Jessica C. Smith. 2011. “Income, Poverty, and Health Insurance Coverage in the United States: 2010.” Current Population Reports, Consumer Income, P60-239. Washington, DC: U.S. Census Bureau, September.
Debels, Annelies, and Leen Vandecasteele. 2008. “The Time Lag in Annual Household-Based Income Measures: Assessing and Correcting the Bias.” Review of Income and Wealth 54(1): 71-88.
Dynan, Karen E., and Donald L. Kohn. 2007. “The Rise in U.S. Household Indebtedness: Causes and Consequences.” Finance and Economics Discussion Series Paper No. 2007-37, Divisions of Research & Statistics and Monetary Affairs. Washington, DC: Federal Reserve Board, August.
Garner, Thesia, Javier Ruiz-Castillo, and Mercedes Sastre. 2003. “The Influence of Demographics and Household-Specific Price Indices on Consumption-Based Inequality and Welfare: A Comparison of Spain and the United States.” Southern Economic Journal 70(1): 22-48.
Johnson, David S., Timothy M. Smeeding, and Barbara Boyle Torrey. 2005. “Economic Inequality Through the Prisms of Income and Consumption.” Monthly Labor Review, April: 11-24.
Kennickell, Arthur B., and Janice Shack-Marquez. 1992. “Changes in Family Finances from 1983 to 1989: Evidence from the Survey of Consumer Finances.” Bulletin 78. Washington, DC: Federal Reserve, January.
Kochhar, Rakesh, Richard Fry, and Paul Taylor. 2011. “Wealth Gaps Rise to Record Highs Between Whites, Blacks and Hispanics.” Washington, DC: Pew Research Center, Social & Demographic Trends project, July.
Krueger, Alan B. 2012. “The Rise and Consequences of Inequality in the United States.” Council of Economic Advisers, Speeches and Testimony. Speech given to Center for American Progress, Washington, DC, January 12.
Meyer, Bruce D., and James X. Sullivan. 2009. “Consumption and Income Inequality in the U.S.: 1960-2008.” Paper presented at IZA/OECD workshop, Paris, February 8-9.
Pew Research Center, Social & Demographic Trends project. 2008. “Inside the Middle Class: Bad Times Hit the Good Life.” Washington, DC: April.
Piketty, Thomas, and Emmanuel Saez. 2003. “Income Inequality in the United States, 1913-1998.” Quarterly Journal of Economics 118(1): 1-41.
Saez, Emmanuel. 2012. “Striking it Richer: The Evolution of Top Incomes in the United States.” Berkeley, CA: March.
Short, Kathleen, Thesia Garner, David Johnson, and Patricia Doyle. 1999. “Experimental Poverty Measures: 1990 to 1997.” Current Population Reports, Consumer Income, P60-205. Washington, DC: U.S. Census Bureau, June.
U.S. Department of the Treasury. 2007. “Income Mobility in the U.S. from 1996 to 2005.” Washington, DC: .
Wolff, Edward N., Ajit Zacharias, and Thomas Masterson. 2012. “Trends in American Living Standards and Inequality, 1959–2007.” Review of Income and Wealth 58(2): 197-232.


