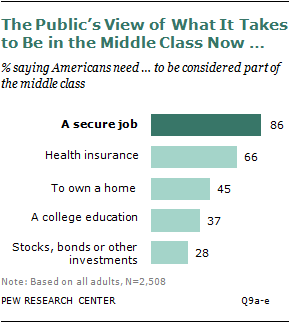
Americans believe that having a secure job is by far the most important requirement for being in the middle class, easily trumping homeownership and a college education, according to a new nationwide Pew Research Center survey of 2,508 adults.
Nearly nine-in-ten adults (86%) say a person needs a secure job to be considered part of the middle class, while just 45% say the same about owning a home, 37% about a college education and 28% about financial investments.
Of the five items tested in the survey question, the only other one seen as essential to a middle-class lifestyle by a majority of the public is health insurance—which for many Americans comes through one’s job. Two-thirds of adults say it’s an essential ticket to a middle-class life.
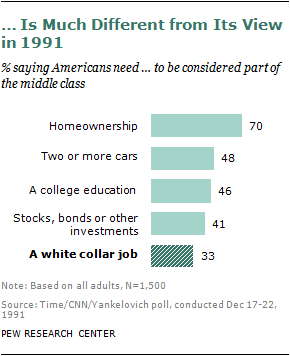
The public’s view about what it takes to be in the middle class appears to have changed dramatically over the past two decades. In a 1991 nationwide Time/CNN/Yankelovich survey, seven-in-ten respondents said homeownership was essential to being in the middle class, while just one-third said the same about having “a white collar job.”1
Some of the sharp differences between the public’s responses in 2012 and 1991 are likely the result of wording differences between the two surveys: “a white collar job” (the wording used in the 1991 survey) is arguably a less inclusive and compelling a choice than “a secure job” (the wording used in the 2012 survey).
But some of the variance may also reflect the persistently high unemployment rates of the past four years as well as a longer-term decline in the share of the working-age public that is employed.
Fewer Americans Are Employed
The share of the population ages 16 to 64 that is employed fell to 67% in 2011, its lowest level since 1983, when it was 66%. 2
This decline began about a decade ago and ended a 50-year period during which an ever-rising share of people were working, a trend fueled largely by the entry of women into the workforce. The share peaked around 2000, when 74% of the nation’s population ages 16 to 64 was employed.
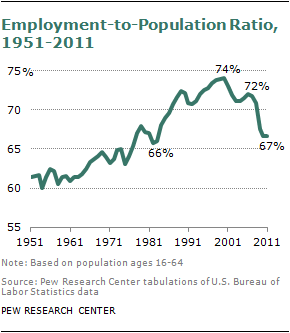
The decline began during a shallow recession in the early 2000s and then accelerated with the Great Recession of December 2007-June 2009 and the sluggish recovery since. From 2006 to 2011, the share of Americans ages 16 to 64 who are employed dropped from 72% to 67%, the steepest five-year decline since 1948, the first year for which employment data are available from the U.S. Bureau of Labor Statistics (BLS).
Over the past 60 years, the trend lines for men and women on these employment measures could hardly be more different. The employment rate for men ages 16 to 64 was nearly 90% at the beginning of the 1950s and has since dropped to 71% in 2010-11, its lowest rate in modern times.
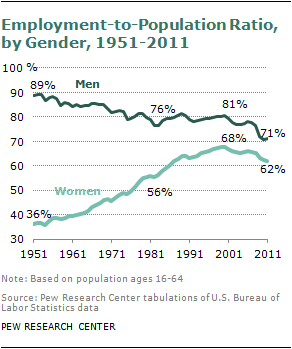
Women’s employment rates started from a much lower base—36% at the beginning of the 1950s—and rose steadily for a half century until they peaked at 68% in 2000. Since then they have dropped to 62%, as the recession took a heavy toll on workers of both genders. The decade from 2001 to 2011 was the first in the modern era when women ages 16 to 64 have not made gains in employment rates over the prior decade.
Demographic Patterns in Views about What It Takes to Be Middle Class
Even though men and women have experienced a different trajectory in their employment rates, they are equally likely to say a secure job is something Americans need to be in the middle class (85% for men vs. 88% for women). Their views on health insurance, owning a home and financial investments are also similar. One exception is in the area of education: Women are more likely than men to say that a college education is needed to be considered part of the middle class (40% vs. 34%).
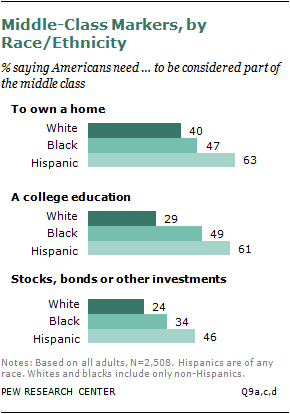
The importance of a secure job and health insurance for the middle class is accepted by Americans of all races. But adults of different races and ethnicities differ in their views about other things. Compared with blacks and whites, Hispanics put higher values on homeownership (63%), a college education (61%) and investments such as stocks or bonds (46%). Blacks are less likely than Hispanics to view these items as necessities to the middle class but are more likely than whites to think so.
In general, Americans ages 50 and older are more likely than younger Americans to value health insurance as a middle-class criterion (71% vs. 61%). But the youngest adults—those ages 18 to 24—also strongly believe that Americans need health insurance to be in the middle class (70%), and they are more likely than older and middle-aged adults to say the same about a college education (47% vs. 35%). Financial investments are less important to young adults: Only about two-in-ten (21%) adults ages 18 to 24 view financial investments as a ticket to a middle-class life, compared with 31% of adults ages 35 and older.
There is a clear partisan divide on the importance of health insurance. Adults who consider themselves Democrats (74%) are more likely than Republicans (58%) or independents (62%) to say that Americans need health insurance to be considered middle class. Democrats also place a higher value than do Republicans on a college education (42% vs. 27%) and owning financial investments (33% vs. 26%).
Homeownership is a marker of a middle-class lifestyle that has significantly dropped in importance over the past two decades. In 1991, 70% of adults said owning a home was important to being in the middle class; today, just 45% feel this way. The decline has occurred across the board, among old and young, men and women, people with different educational attainment. During most of the 1990s and early 2000s, home values rose steadily, but after the housing bubble burst in 2006, home prices fell by about 30% and have not recovered. The share of the public that owns a home has also declined. 3
The Importance of Job Security
The value Americans place on having a secure job is underscored by findings from the same Pew Research survey that show that losing a job is associated not just with economic difficulties, but also with stress and unhappiness.
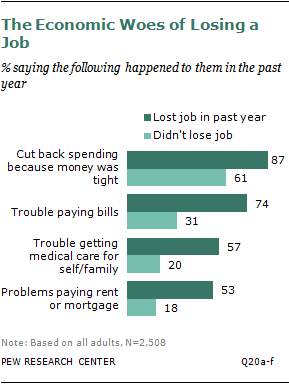
In the Pew Research survey, 15% of respondents said they lost their job or got laid off in the past year. 4 Those who lost jobs have faced many economic hardships in their day-to-day lives over the past year: Close to nine-in-ten (87%) say they had to cut back their household spending because money was tight,about seven-in-ten (74%) had trouble paying bills, about six-in-ten (57%) say they had trouble getting or paying for medical care for themselves or their family, and about half (53%) say they had problems paying their rent or mortgage. In each case, the rate among adults who experienced a job loss in the past year is much higher than the rate among those who did not.
Job loss is also related to a lower level of financial confidence for the future. About three-in-ten (31%) adults who lost a job in the past year say that they are “not at all confident” about having enough income and assets to last throughout their retirement years, compared with 14% of adults who did not have the experience.
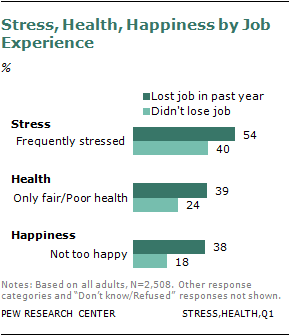
The experience of losing a job affects life in other ways. It is related to a higher level of stress in daily life, poorer health and a lower level of happiness, according to what respondents reported in the survey. About half of adults (54%) who lost a job last year say they are “frequently” stressed in daily life, roughly four-in-ten (39%) rate their health as “only fair” or “poor,” and 38% say they are not too happy in life. These rates are much higher than those among adults who did not experience a job loss last year.
For Those Who Have Jobs, Satisfaction Level Is High
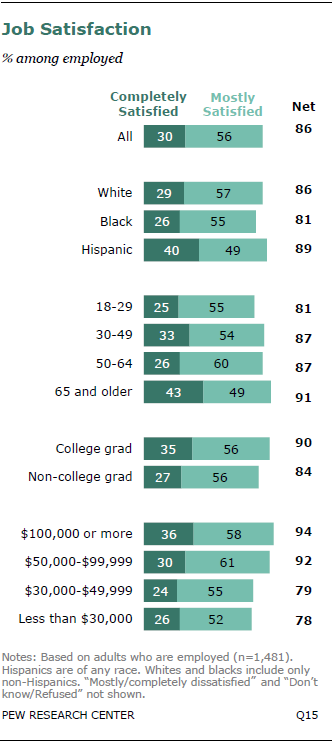
A vast majority of American workers (86%) say they are either completely or mostly satisfied with their jobs, 10% say they are mostly dissatisfied, and only 3% of workers are completely dissatisfied with their jobs.
Underemployment affects job satisfaction. Of all workers, about one-quarter (24%) report that they are currently working part time, and about half of these part-time workers (53%) say they would prefer to be working full time. Workers who are currently part time but want a full-time job are less happy about their jobs. The job satisfaction rate is 67% among underemployed workers but 94% for those who choose to work part time.
Job satisfaction also varies by some demographic characteristics. Hispanic workers are more likely than black workers to be satisfied with their jobs overall (89% vs. 81%), and they are more likely to say they are “completely satisfied” with their jobs (40%), compared with 29% of white and 26% of black workers.
Men and women are equally satisfied with their jobs. Older workers, especially those ages 65 and older, have a higher satisfaction rate (91%) at work than do workers younger than 30 (81%). The age difference is also reflected at the degree of satisfaction: Only a quarter of workers in their 20s are “completely satisfied” with their jobs, compared with about four-in-ten (43%) workers ages 65 or older.
Higher education and income is related to higher job satisfaction. Workers with a college education are more satisfied with their jobs than those without a college degree (90% vs. 84%). And nine-in-ten workers whose family income is $50,000 or higher are satisfied with their job, compared with about eight-in-ten of those with a family income below $50,000.
Making Progress on Career Goal
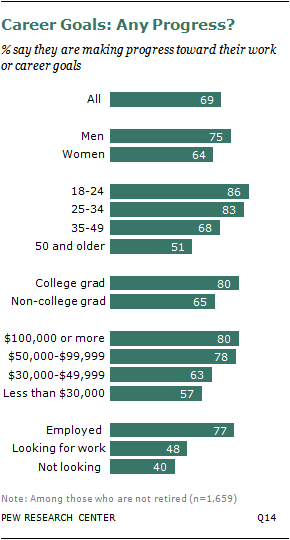
The Pew Research survey also asked all but retired adults about their work or career goals. Overall, Americans are positive about the progress they are making toward their career goals. About seven-in-ten (69%) say that they are making progress to advance their work or career, about a quarter (24%) say they are not making progress, and 3% volunteer that there is no change in terms of their work or career advancement.
In general, a higher percentage of men than women say that they are making progress toward their work or career goals (75% vs. 64%). However, this finding varies by race. Black men and women do not differ in their perceived progress toward work or career goals (70% vs. 71%, respectively), but the gender difference is significant between white men (76%) and women (62%) as well as between Hispanic men (75%) and women (62%).
Younger adults are more positive than older adults about their progress at work. About eight-in-ten (84%) of young adults ages 18 to 34 say they are making progress toward their goals, compared with about half of the adults (51%) ages 50 or older.
Education also matters. College-educated adults are more likely than those without a four-year college degree to say they are making progress in their job or career (80% vs. 65%). And adults with higher family income are also more positive about their progress than are those with lower family income.
Not surprisingly, employment status is directly related with how people view the progress about their career goals. Roughly three-quarters of employed adults (77%) are satisfied with their career progress, compared with 48% of adults who are looking for work and 40% who are not looking.
About the Data
This report is mainly based on a Pew Research Center telephone survey conducted July 16 to 26, 2012, with a nationally representative sample of 2,508 adults ages 18 and older. The survey included an oversample of 407 blacks and 377 Hispanics. A total of 1,505 interviews were completed with respondents contacted by landline telephone and 1,003 with those contacted on their cellular phone. Data are weighted to produce a final sample that is representative of the general population of adults in the continental United States. Survey interviews were conducted in English and Spanish under the direction of Princeton Survey Research Associates International. Margin of sampling error is plus or minus 2.8 percentage points for results based on the total sample, 5.7 percentage points for non-Hispanic blacks and 5.5 percentage points for the Hispanic subsamples at the 95% confidence level. Notes on terminology: Hispanics are of any race. Whites and blacks include only non-Hispanics. “College graduate” refers to anyone with at least a bachelor’s degree, including those with a graduate or professional degree. “Non-college graduate” refers to those who completed some college credits or received associate degrees, those who have a high school diploma or its equivalent, and those who have not completed high school.
Supplementary data of the employment rate are from Current Population Survey, U.S. Bureau of Labor Statistics.
Acknowledgments
Paul Taylor, director of the Pew Research Center’s Social & Demographic Trends project, gave guidance and also edited the report. Associate director Kim Parker provided helpful comments on earlier drafts, as did senior editor Rich Morin. Senior researchers Rakesh Kochhar and Richard Fry gave advice and comments on the employment data from Bureau of Labor Statistics. Research assistant Seth Motel helped with presenting the employment data, and research assistant Eileen Patten numbers-checked the report. Marcia Kramer copy-edited the report.


