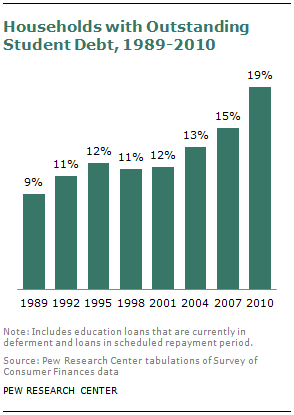
About one out of five (19%) of the nation’s households owed student debt in 2010, more than double the share two decades earlier1 and a significant rise from the 15% that owed such debt in 2007, just prior to the onset of the Great Recession, according to a Pew Research Center analysis of newly available government data.
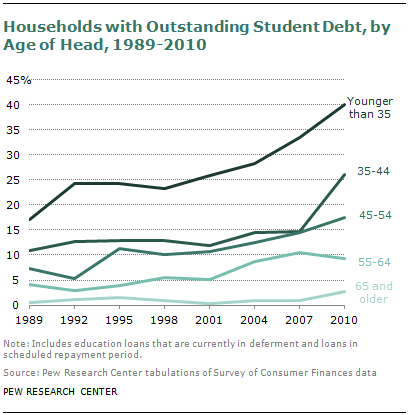
The Pew Research analysis also finds that a record 40% of all households headed by someone younger than age 35 owe such debt, by far the highest share among any age group.
It also finds that, whether computed as a share of household income or assets, the relative burden of student loan debt is greatest for households in the bottom fifth of the income spectrum, even though members of such households are less likely than those in other groups to attend college in the first place.2
Since 2007 the incidence of student debt has increased in nearly every demographic and economic category, as has the size of that debt.
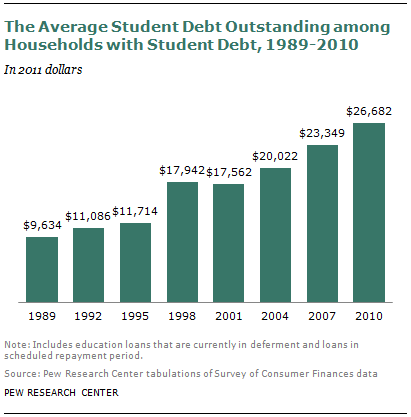
Among households owing student debt, the average outstanding student loan balance increased from $23,349 in 2007 to $26,682 in 2010. Most debtor households had less than $50,000 in outstanding student debt in 2010, but the share of households owing elevated amounts has increased. In 2007, 10% of student debtors owed more than $54,238. By 2010, 10% of student debtor households owed more than $61,894 (all dollar figures adjusted for inflation and in 2011 dollars).
While every income group had more total student loan debt in 2010 than in 2007, the increases were greatest at the two extremes of the income distribution—households in the lowest fifth of households by annual income and in the highest fifth—than in the middle three-fifths.
In 2010 the least affluent fifth of households owed 13% of the outstanding student debt, up from 11% in 2007. Similarly the share of the outstanding student debt pie owed by the richest fifth of households rose from 28% in 2007 to 31% in 2010.
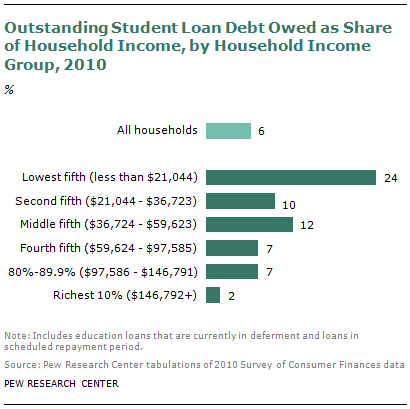
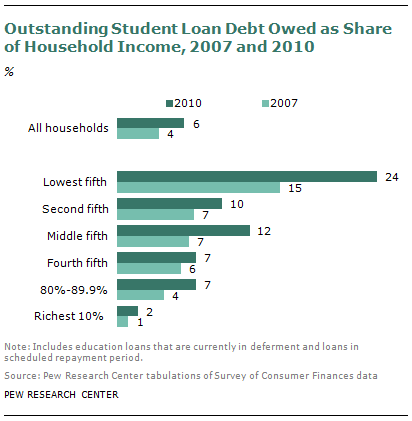
While those at the upper end of the income scale are more likely than others to owe student loan debt, when one considers the resources that households have at their disposal to meet their debts, the relative burden of student loans is much greater for those at the lower end. In 2010 outstanding student debt was nearly a quarter (24%) of the household income of the lowest fifth of households by annual income. By comparison, households in the ninth decile of household income owed only 7 cents of student debt for every dollar of household income received, and those in the tenth decile (90 percent and higher) owed just 2 cents of student debt for every dollar of household income.
Because outstanding student debt has been rising and household incomes have been falling since 2007, outstanding educational debt has risen as a share of household income for all income groups considered. The outstanding student-debt-to-income ratio nearly doubled for the richest fifth of households from 2007 to 2010, but it remains the case that in both years the ratio of student debt to income was markedly higher for the lowest fifth of households by income. Student debt represented 15 cents of every dollar of household income for the lowest fifth of households in 2007. Even with the recent run-up, educational debt represents a much smaller share of household income for the richest fifth of households in comparison to the lowest fifth of households by annual income.
Leverage ratios, or comparing the outstanding student debt to the household’s assets, tell a similar story. The outstanding student debt in 2010 was 2.2% of the total value of the assets owned by the lowest fifth of households by income. The student debt was only 1.1% of the assets owned by the richest ninth decile of households and a mere 0.2% of the assets owned by the richest tenth of households.
Rising student debt burdens can also be evaluated in light of the other debts owed by households, such as property-related debt, credit card debt and all installment debt. Student debt is a growing share, rising from 3% of outstanding total debt owed by households in 2007 to 5% of all debts in 2010. This reflects growing outstanding student debt and the fact that households have reduced their other debts. Average household indebtedness fell from $105,297 in 2007 to $100,720 in 2010.3
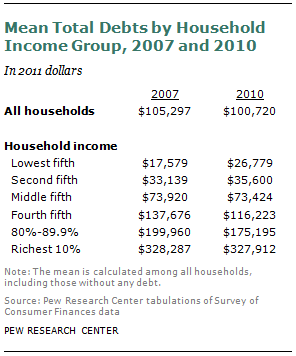
The decline in total indebtedness in spite of rising student debt burdens has not been shared by all households. The average total indebtedness of the lowest fifth of households by annual income rose from $17,579 in 2007 to $26,779 in 2010. Total indebtedness for households in the middle and upper fifths of the income distribution either remained unchanged or declined. The lowest income households have mounting debt obligations in addition to mounting student debt obligations, while the nation’s higher income households have declining other debts in the face of mounting student debt obligations.
About the Report
This report examines outstanding student loan debt in the context of the debtor household’s other debts, assets and other measures of economic ability to handle the student debt. It is based on the Survey of Consumer Finances (SCF), a triennial survey of the financial characteristics of U.S. households sponsored by the Board of Governors of the Federal Reserve with the cooperation of the U.S. Department of the Treasury. The most recent SCF is 2010. The SCF questionnaire has undergone only minor revisions since 1989, and this report analyzes SCF data from 1989 to 2010. The SCF is the nation’s foremost source of data on the wealth or net worth of the nation’s households and use of financial services (as well as the demographic characteristics of the households). Numerous data sources provide detailed information on college student borrowing and its relation to other components of students’ financing their education (for example, the National Postsecondary Student Aid Study, or NPSAS). The value of the SCF is that it sheds light on the role of student debt among persons no longer enrolled in postsecondary education as well as the other debts, assets and wider economic context of student debtors.
“Student debt” or “college debt” in this report refers to outstanding education-related installment debt and includes loans that are currently in deferment as well as loans in their schedule repayment period.
“High school graduate” comprises those who graduated with a regular diploma or its equivalent, such as a GED, but did not obtain any college education. The educational level “some college” refers to those who do not have a four-year college degree, but have completed some college credits, including those who received associate degrees. “College graduate” refers to anyone with at least a bachelor’s degree, including those with a graduate or professional degree.
“Wealth” is the difference between the value of assets owned by a household (such as home, stocks and savings accounts) and its liabilities (such as mortgages, credit card debt and loans for education). The terms “net worth” and “wealth” are used interchangeably in this report.
Dollar amounts are adjusted for inflation and reported in 2011 dollars unless otherwise noted.
See Appendix A for additional details on the SCF and definitions of net worth, household income and household economic groups.
This report was written by Richard Fry. Paul Taylor, executive vice president of the Pew Research Center and director of its Social and Demographic Trends project, assisted the writing of the overview and provided guidance on the structure of the report. Research assistant Seth Motel provided expert assistance with the preparation of charts and formatting the report. The report was number-checked by research assistant Eileen Patten and Motel. The report was copy-edited by Marcia Kramer.


