Blacks voted at a higher rate this year than other minority groups and for the first time in history may also have voted at a higher rate than whites, according to a Pew Research Center analysis of census data, election day exit poll data and vote totals from selected cities and counties.
Unlike other minority groups whose increasing electoral muscle has been driven mainly by population growth, blacks’ rising share of the vote in the past four presidential elections has been the result of rising turnout rates.
These participation milestones are notable not just in light of the long history of black disenfranchisement, but also in light of recently-enacted state voter identification laws that some critics contended would suppress turnout disproportionately among blacks and other minority groups.
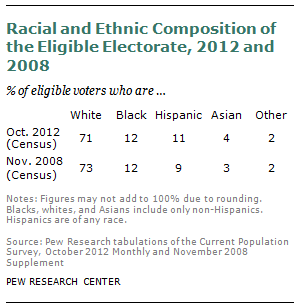
In fact, according to census data and the election day exit polls, blacks made up 12 percent of the eligible electorate1 this year but accounted for an estimated 13 percent of all votes cast—a repeat of the 2008 presidential election, when blacks “over-performed” at the polls by the same ratio. In all previous presidential elections for which there are reliable data, blacks had accounted for a smaller share of votes than eligible voters.
The candidacy in 2008 and 2012 of Barack Obama, the nation’s first black president, is no doubt one of the main reasons for these new patterns. But there are other explanations as well, including the increased racial and ethnic diversity of the electorate, and a declining turnout rate among whites.
In 2012, more Hispanics and Asian-Americans voted than ever before, but the turnout rates among these groups (votes cast as a share of eligible voters), while rising, continues to lag that of the general public by a substantial margin. Their growing electoral muscle is mainly due to their rapid population growth.
As for whites, not only has their share of the eligible electorate been falling for decades, but their turnout rate appears to have declined in 2012 for the second presidential election in row.2
Did the turnout rate of blacks exceed that of whites this year for the first time ever? For now, there’s circumstantial evidence but no conclusive proof. And there’ll be no clear verdict until next spring, when the U.S. Census Bureau publishes findings from its biannual post-election survey on voter turnout.
Even so, there’s a good bit that’s already known. Overall, about 129 million votes were cast for president in 2012, down slightly from 131 million in 2008. When one factors in a 9 million increase in the age and citizen eligible electorate due to normal population growth between those two elections, the turnout rate among all eligible voters fell by more than 3 percentage points—to about 60% in 2012 from more than 63% in 2008.
The most authoritative measure of turnout by racial and ethnic groups comes from the census survey known as Voting and Registration Supplement, which is conducted in late November after every federal election among a nationally representative sample of about 100,000 adults.

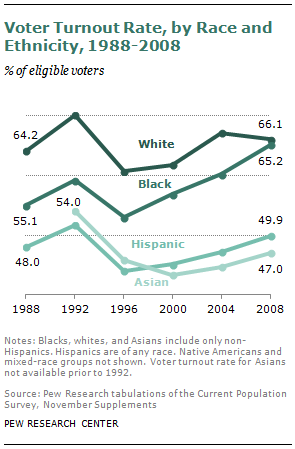
While the 2012 finding won’t be made public for several months, a backward look at recent trends from this data set is instructive. In 2008, according to the post-election census survey, the gap between white and black turnout was the smallest on record. Some 66.1% of all age and citizen eligible whites voted that year, compared with 65.2% of blacks, 49.9% of Hispanics and 47% of Asian Americans. The survey found that the white turnout rate had declined by 1.1 percentage points between 2004 and 2008, while the rates for the other groups all rose—by 4.9 percentage points among blacks, 2.7 among Hispanics and 2.4 among Asians.
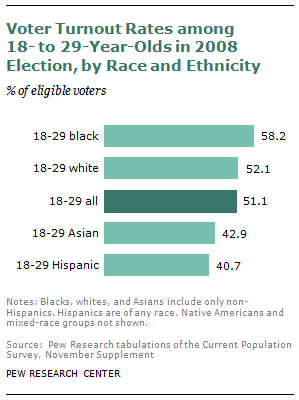
The post-election survey also showed that in 2008, young blacks (18 to 29 year olds) voted at a higher rate than young whites (58% versus 52%) – a difference that was almost certainly related to the historic nature of the Obama candidacy, but that might foreshadow patterns in political engagement among the Millennial generation that could persist throughout adulthood.
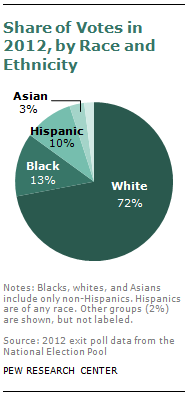
The political importance of turnout rates by race was brought into sharp focus by last month’s election, in which Obama won 80% of the non-white vote (including 93% of blacks, 73% of Asian Americans and 71% of Hispanics) and just 39% of the white vote. That constellation of votes by race gave Obama a popular vote victory margin this year of 4.7 million and an Electoral College victory of 332-206.
For comparative purposes, consider the 1988 presidential race between GOP nominee George H.W. Bush and Democrat Michael Dukakis. Bush received the identical share of the white vote that GOP nominee Mitt Romney won this year – 59%. But 24 years ago, that share was good enough to give Bush a popular vote margin of 7 million and an Electoral College landslide of 426-111.
The stark difference in those two outcomes is a reflection of the country’s rapidly changing demographic makeup, driven mainly by the population growth among Hispanic and Asian American immigrants and their children.
Blacks, by contrast, have not seen their share of the population grow during this period. But their electoral clout has increased because their participation rates have risen steadily in the three presidential elections from 2000 to 2008.

As for 2012, the best available data for now on turnout by racial and ethnic groups are from the National Election Pool, an election day exit survey of more than 26,000 voters conducted by a consortium of major media organizations.
These surveys are best known for enabling an analysis of which groups voted for which candidate. They can also be used to estimate the share of all voters by race and ethnicity (as well as by other demographic characteristics). However, these estimates should be treated with caution. In 2008, as the accompanying tables show, the estimates derived from the election day exit poll were not the same as the estimates derived from the post-election survey by the U.S. Census Bureau. There is no guarantee this will not be the case again in 2012.3
Even with that caveat in mind, the exit poll is instructive. As the tables show, in 2012 blacks and whites both appear to have cast a slightly higher shares of votes (72% and 13%, respectively) than their share of eligible voters (71% and 12%), while Hispanics and Asians cast a lower share of votes (10% and 3%) than their share of eligible voters (11% and 4%).
That still leaves unanswered whether the black turnout rate in 2012 surpassed the white turnout rate. If so, it would be a notable denouement to the charged debate this year between state GOP leaders who pressed for tougher laws to deter voter fraud and black and other minority group leaders who accused them of trying to suppress the minority vote. This fall, black pastors, community leaders and elected officials across the country used these new identification laws as a spur to energize turnout.
In an effort to further explore whether black turnout exceeded white turnout in 2012, Pew Research asked voter turnout expert Rhodes Cook to analyze the number of votes cast in 2008 and 2012 in a sampling of heavily black and heavily white cities and counties across the country. Cook gathered the official counts from state election officials and relied on his extensive knowledge of the nation’s demographic and political characteristics, down to the county level, to select the sample.
His findings are presented in Appendix A. They show a mix of turnout increases and decreases, with no clear pattern. In short, blacks may have achieved an historic turnout milestone at the polls last month – even in the face of what many black leaders said was an effort to suppress their vote. But for now, there’s no conclusive proof.


