After a divisive presidential campaign that focused on such polarizing issues as economic class and immigration, a new Pew Research survey finds that the American public perceives less conflict between groups at the center of these debates now than before the campaign began.
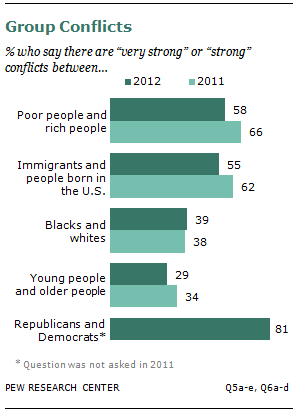
The survey finds that 58% of adults say there are “very strong” or “strong” conflicts in our society between the rich and the poor, down from the 66% who said the same in a December 2011 survey.
Similarly, 55% of adults say there are very strong or strong conflicts between immigrants and the native born, down from the 62% in late 2011.
At the same time, a larger share of the public sees major partisan conflict (81%) than see similarly large disputes between rich and poor (58%), immigrants and native born (55%), blacks and whites (39%) or the old and the young (29%).1
The survey, which was conducted among a nationally representative sample of 2,511 adults from Nov. 28 to Dec. 5, 2012, as President Obama and Republicans in Congress clashed over whether to raise taxes on the wealthy, finds that, overall, three-in-four Americans see very strong or strong conflicts in two or more of the five areas measured in the survey.
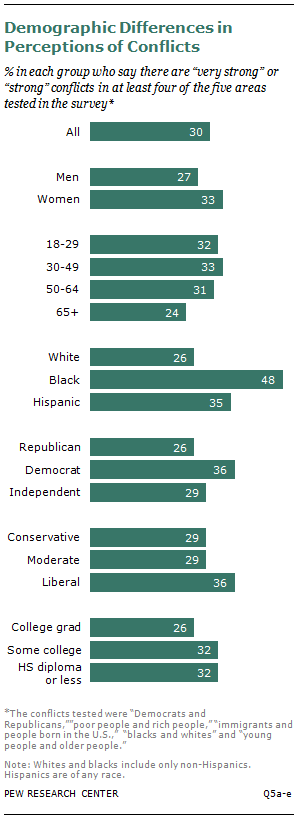
Three-in-ten say there are strong disagreements in at least four out of the five domains tested, including about half of all blacks (48%) but 26% of whites. Women, Democrats and political liberals are more likely than men, Republicans or conservatives to see major disagreements in four or more social arenas.
The remainder of this report examines each of the five social conflicts in more detail. It concludes by determining the extent to which Americans see many social conflicts and identifies the demographic groups that see multiple areas of serious disagreement compared with those who say there are relatively few.
Conflicts Between the Rich and Poor
Led by a sharp decline among women and middle-income adults, the proportion of Americans who see “very strong” or “strong” conflicts between the rich and poor fell from 66% in 2011 to 58% in the latest survey.
These data do not point to a clear explanation for the decline. However the 2011 survey was conducted in the weeks after the Occupy Wall Street movement focused national attention on disparities between the poor and the top-earning “one percent.”
Still, the latest result remains 11 percentage points above the 47% who saw serious disagreements along economic class lines in 2009, the first time that the Pew Research Center asked the question.
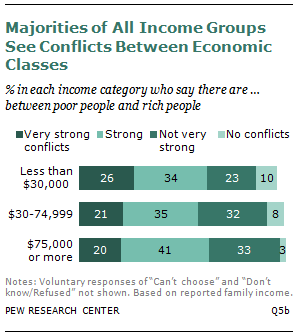
Those at or near the top and the bottom of the income ladder agree that there are major conflicts between the rich and poor. According to the survey, six-in-ten adults (60%) with family incomes of less than $30,ooo see strong disagreements between the classes—and so do 60% of those earning $75,000 or more.
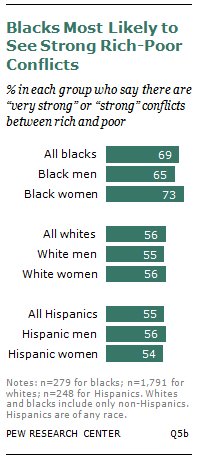
Majorities of other major demographic groups also say there are strong conflicts between the rich and poor. Blacks—particularly black women—are more likely than whites to see disagreements along class lines.
According to the survey, about seven-in-ten blacks (69%) but 56% of whites and 55% of Hispanics say there are strong conflicts between those at the top and the bottom of the income ladder.
The Politics of Economic Conflict
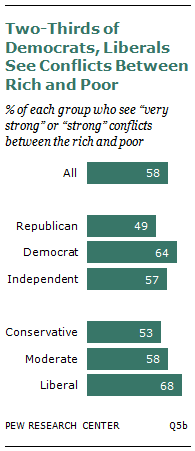
Democrats are significantly more likely than Republicans to see strong conflicts between the rich and poor (64% vs. 49%). Self-described political independents fall squarely in the middle (57%); as a group, they see appreciably more conflict than Republicans but significantly less than Democrats.
The survey also found that political liberals are significantly more likely than conservatives or moderates to say there are serious conflicts between the economic classes.
According to the survey, about two-thirds of liberals (68%) but roughly half of conservatives (53%) see large areas of conflict between the wealthy and the poor. Liberals also are more likely than political moderates (58%) to sense serious discord along economic class lines.
Where the Decline Was Greatest
The proportion of Americans that see major conflicts along economic class lines fell in most major demographic groups. But some of the largest declines occurred among women and those with annual family incomes between $30,000 and $75,000.
According to the survey, the proportion of women who see major class conflicts fell 13 percentage points from 71% in 2011 to 58% this year. In contrast, the proportion of men who express this view fell three percentage points in the past year (60% vs. 57%), a difference that is not statistically significant.
The share of political independents who say there are major disagreements between the rich and poor declined from 68% to 57%, an 11 percentage point drop. Among Democrats, the decline was nine points, while the share of Republicans who see serious class divisions dropped by six points.
Double-digit declines were also recorded among liberals (-11 percentage points) and moderates (-10), while the drop for conservatives was only two points.
Conflicts Between Immigrants and Non-Immigrants
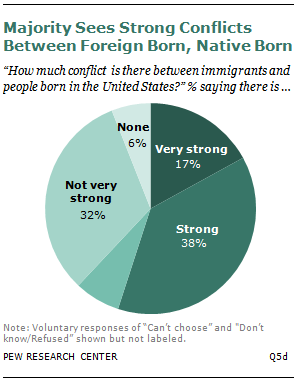
A 55% majority of adults say that strong conflicts exist today between immigrants and non-immigrants. About four-in-ten (38%) say the conflicts are “strong” and 17% say they are “very strong.”
Hispanics are more likely than non-Hispanic whites to see major disagreements in this area. Six-in-ten Latinos (61%) say there is a strong conflict today between immigrants and native-born Americans, compared with 52% of non-Hispanic whites. Among non-Hispanic blacks, 56% agree.
Only about half (49%) of first-generation Americans—the immigrant generation—see such a conflict. Second-generation Americans—native-born Americans who have at least one immigrant parent—are more likely to sense discord (61%).
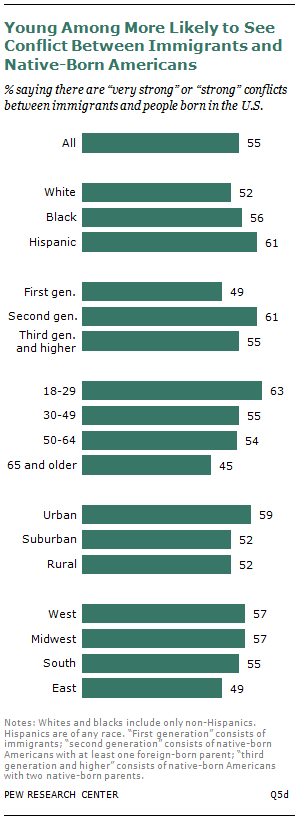
The survey also found that adults ages 18 to 29 are the most likely age group to see strong conflicts between immigrants and native-born Americans. Among these young adults, six-in-ten (63%) see conflicts. In contrast, less than half (45%) of adults ages 65 and older share that view. Those ages 30 to 64 fall in between. Of the five conflicts tested, this is the only one in which young adults view significantly more conflict than every other age group.
People living in urban areas say there is more discord between immigrants and non-immigrants than those living in either the suburbs or rural areas. Six-in-ten (59%) urbanites believe there is strong or very strong conflict between native-born Americans and immigrants, compared with 52% of both suburban and rural residents.
A greater share of residents in the Midwest and West say there is conflict (57% each) than those who live in the East (49%). Southerners are not significantly different from the other three regions (55% see conflicts).
The 55% of adults who see very strong or strong conflicts between the two groups is a decline from a 2011 Pew Research survey (62%), but it is the same share as in 2009.
In addition, a significant partisan gap that existed in 2011 disappeared in this survey, due largely to a 10 percentage point decline in the share of Democrats who see very strong or strong conflicts between these groups (66% to 56%).
At the same time, Republicans’ views stayed about the same (57% in 2011 and 55% in 2012). The result is that partisans today are about evenly split.
Conflicts Between Blacks and Whites
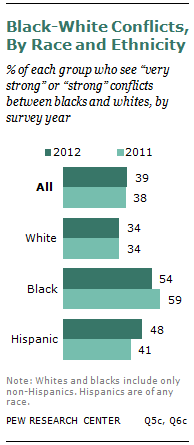
In the latest poll, overall perceptions of conflict between blacks and whites remain largely unchanged from a Pew Research survey conducted a year earlier.
About a third of whites in both surveys (34%) say there are “very strong” or “strong” conflicts between the races, while a significantly larger share of blacks see similarly serious racial disagreements (54% in the latest poll, 59% in 2011).
Among Hispanics, about half in the latest survey (48%) see major conflicts between blacks and whites while 41% expressed the same view a year ago, a difference that falls just short of being statistically significant.
But these overall results hide an important change in how blacks currently see the racial divide. Currently about two-in-ten (19%) of all blacks say there are very strong conflicts between the races, down nine percentage points from 2011.
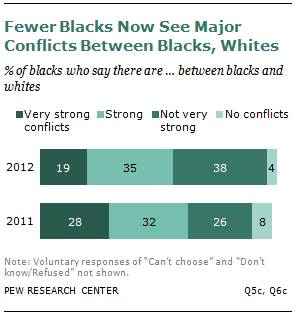
At the same time, about four-in-ten blacks in the latest survey (38%) say that black-white conflicts are “not very strong,” an increase from 26% a year ago.
Among whites, the proportion who sees very strong racial conflicts remains basically unchanged (6% in 2011 and 7% in the latest poll). The share of Hispanics who perceive major disagreements between blacks and whites also remains unchanged in the two surveys (16% and 18% respectively).
Young vs. Old
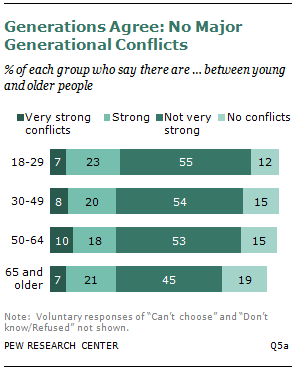
Five decades after the tumultuous 1960s pitted young adults against their parents, the generation gap continues to fade as a major source of conflict in American life.
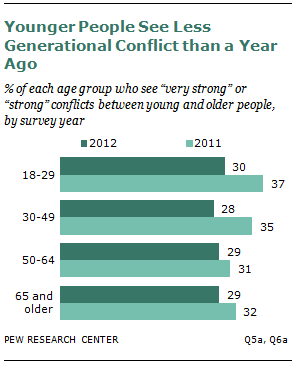
About three-in-ten Americans (29%) say there are strong conflicts between young adults and older people, down from 34% in 2011. For the third survey in a row, disagreements between the young and old ranked the lowest of the four social conflicts tested since the question was first asked by Pew Research in 2009.2
Another sign of peace between the generations: Big majorities of every age group say there are only minor disagreements or none at all between the two age groups. Two-thirds (67%) of adults under the age of 30 and 64% of those ages 65 and older say there are “not very strong” conflicts or “no conflicts” between the old and young.
At the same time, the survey suggests that a significant proportion of the decline since 2011 has occurred among adults younger than 50. About three-in-ten adults (29%) younger than 50 say there are “very strong” or “strong” conflicts between the young and old, down from 36% in 2011.
Among those 50 and older, the share that sees very strong or strong conflicts between young people and older adults remained largely unchanged (29% in the latest poll vs. 31% last year).
Republicans vs. Democrats
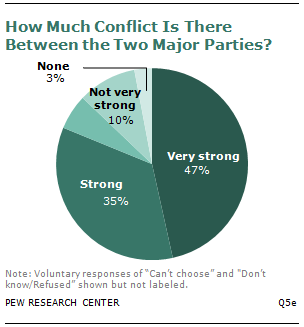
About eight-in-ten adults see strong conflicts between Democrats and Republicans, by far the largest of the five conflicts tested in the survey. And the existence of such a deep partisan divide is something that Americans actually agree on across party and ideology.
Equally large shares of Republicans and Democrats (83%) say there are strong conflicts between the two major political parties, while 80% of political independents agree. Virtually identical proportions of self-described conservatives (81%), liberals (83%) and moderates (83%) also see strong disagreements between the two major parties.
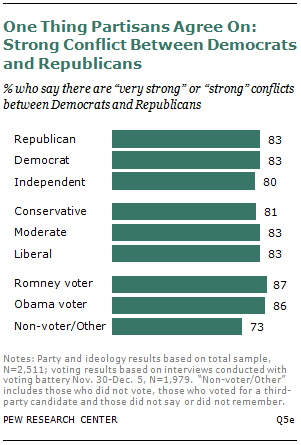
While voters were narrowly split between President Obama and Mitt Romney in November, they come together in their feelings about the partisan divide. Among Romney voters, 87% see a strong conflict, a sentiment mirrored by 86% of Obama voters. Those who sat out the election or voted for another candidate see a lower level of perceived conflict (73% say it is strong).
Overall, 81% say there are “strong” or “very strong” conflicts between the two parties. Roughly half (47%) of American adults identify very strong conflict between the two parties. This measure is at least double that of every other conflict measured in the survey.
Just 13% say there are not very strong conflicts or none at all between the major parties—10% say the conflicts are not very strong and only 3% say there are no conflicts.
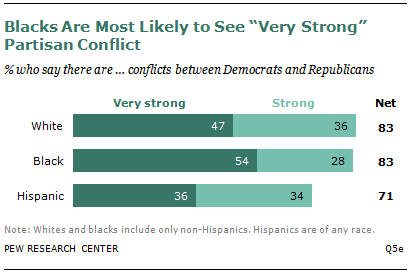
Views of the conflict differ by race and ethnicity. Blacks identify the strongest conflict between the two parties, with 54% seeing it as very strong. Among white adults, 47% say the same. When responses of very strong and strong are combined, however, 83% of both races say there is conflict.
Meanwhile, Hispanics are the least likely to see a strong conflict between Democrats and Republicans. About seven-in-ten Hispanics (71%) say there is a strong conflict, including 36% who say it is very strong.
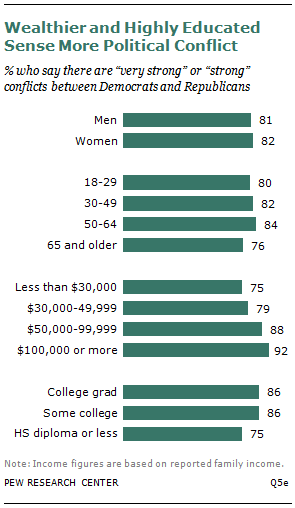
Adults with family incomes of at least $50,000 are more likely than those making less than $50,000 to sense this conflict. Among those with family incomes of $100,000 or more, 92% believe there is a strong conflict between the two political parties. The same is true among 88% of people with an annual family income of between $50,000 and $100,000. Adults with family incomes of between $30,000 and $50,000 are less likely to agree (79%). People whose family incomes are less than $30,000 also perceive less conflict than the wealthiest Americans, although 75% still agree.
There is also an age gap in the perception of partisan discord. Adults ages 65 and older sense less partisan conflict than younger adults. By a margin of 82% to 76%, adults ages 18 to 64 are more likely than older adults to believe there are strong conflicts between the two parties.
In addition, educational attainment correlates with how people view the conflict. College graduates and adults who have attended at least some college see the conflict as similarly strong (86%). But this perception drops to 75% among adults who have a high school diploma or less.
Gender is one demographic factor that does not appear to matter in regard to the issue. About equal shares of women (82%) and men (81%) call the discord between Democrats and Republicans very strong or strong.
Policies and the Partisan Divide
How strongly people view the partisan conflict is related to some personal opinions about entitlements and the budget.
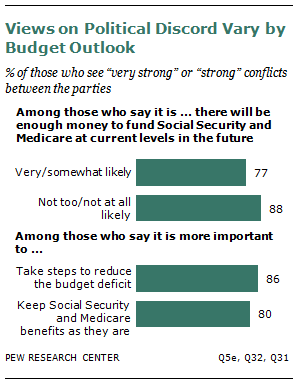
Respondents were asked whether there would be enough money in the future to provide Social Security and Medicare benefits at their current levels. Those who think it is unlikely that these programs will be adequately funded sense more conflict between the two parties than those who believe there will be enough money. About nine-in-ten (88%) people who are pessimistic about such funding say the parties have strong conflicts, compared with 77% of those who think there will be enough money in the future.
There is also a difference based on whether a person believes it is more important to reduce the budget deficit or to keep Social Security and Medicare benefits as they are. A greater share of Americans who say it is more important to reduce the budget deficit see strong partisan conflict than the proportion who says they would rather keep Social Security and Medicare benefits unchanged (86% vs. 80%).
A Country in Conflict?
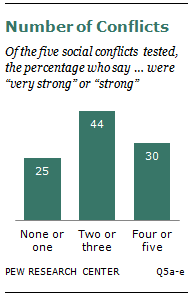
Do most Americans see many serious social conflicts in American life, or just one or two? To find the answers, Pew Research took the five questions, each measuring a different social divide, and totaled the number of conflicts that a respondent said were “very strong” or “strong” areas of disagreement.
The resulting scale ranged from zero if a respondent said none of the five conflict areas were particularly serious to five if a respondent said all five were.
Overall about half of all Americans (53%) say there are strong disagreements in three or more of the five conflict areas tested in the poll. Three-quarters identify two or more as being as serious. Only about 10% say all five areas are particularly strong, while about as many (8%) say none of the five are very contentious.
Notable differences emerge when the 30% who see four or more serious conflicts are broken down by demographic group.
About half of all blacks (48%) say there are very strong or strong conflicts in four or more of the areas tested in the survey. In contrast, about a quarter of whites (26%) and 35% of Hispanics see as many of these social divisions as being as serious.
Women are somewhat more likely than men to say there are very strong or strong conflicts in at least four of the five areas tested in the survey (33% vs. 27%).
Adults under the age of 65 see more serious social divides than older people (32% for those 18 to 64 vs. 24% for adults 65 and older). Those who have not completed college also are more likely than college graduates to see four or more major social divides (32% vs. 26%).
Politically, Democrats are more likely than Republicans to see conflicts in four or more areas (36% vs. 26%) while 29% of independents agree. Liberals also are somewhat more likely than conservatives or moderates to see as many areas of strong social disagreement (36% vs. 29% for conservatives and 29% for moderates).
Comparisons with 2011
A similar analysis was done using the four group conflicts that were measured on both the 2011 and 2012 surveys: rich/poor, immigrants/native born, young/older people and blacks/whites.
The results confirm the overall pattern of declining conflict. The share that says there are “very strong” conflicts in all four areas declined from 14% to 11%, while the share who say there were two or three areas of strong dispute fell by five percentage points to 45%. At the same time, the proportion who say there were only one or no serious group conflicts increased from 36% to 44%.