Overview
Many of the nation’s U.S.-born children of immigrants are just coming into adulthood, but as a group they already are having an impact on the nation’s communities, workforce, electorate and other realms of American life.
The most striking features of this U.S. second generation—the adult children of immigrants—are their youth and their racial and ethnic background. Most were born since the onset of the nation’s most recent four-decade wave of immigration, mainly from Latin America and Asia.
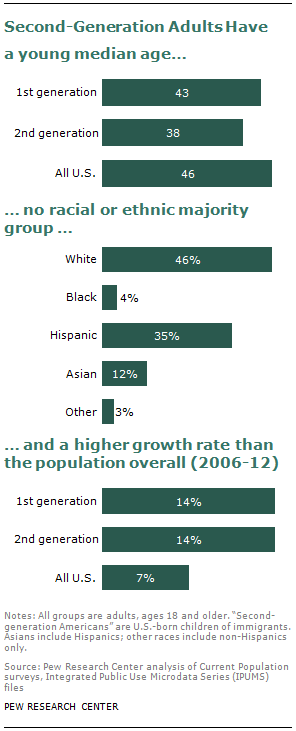
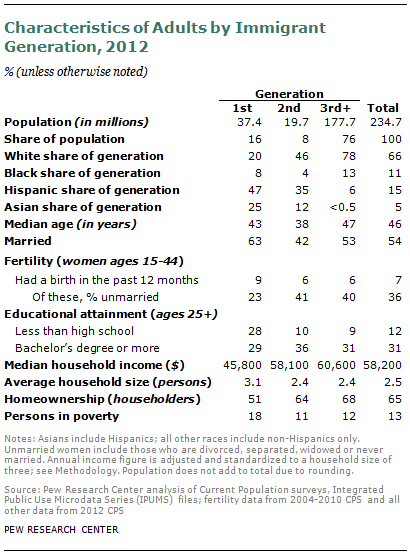
The median age of second-generation adults is 38, compared with 43 for foreign-born adults and 46 for all adults. This generation is distinct as well for its racial and ethnic mix, in which no group holds a majority, and for its above-average intermarriage rate.
Second-generation adults in the U.S. today are not necessarily the children of immigrants in the U.S. today. Although today’s second generation includes some adults who are the children of today’s immigrant population, it also includes some whose parents arrived more than a century ago and are no longer living so are not in the data. The reverse also is true: Today’s immigrants are not necessarily the parents of the adult second generation. The U.S. first generation includes some immigrants who have no children or whose children are not yet adults.
Furthermore, because generational progress occurs over years or decades, a true comparison between the first and second generations would show today’s second generation compared with their parents at a similar stage of life. That would require historical data not available here.
For these reasons, comparisons between immigrant generations should not necessarily be used to assess generational progress.
That said, a snapshot comparison indicates that in some realms of life, the second-generation U.S.-born adult children of immigrants are better off than the people who make up the first generation. They have more education, reflecting the higher educational attainment in the U.S. compared with the home countries of many immigrants. Their higher education levels help explain why they have higher household incomes and a lower share in poverty than immigrants. They are slightly less likely to be married than immigrants, reflecting their younger age structure, and their share of births to unmarried mothers is higher, perhaps reflecting adaptation to U.S. customs.
In general, the second generation, who are U.S. citizens at birth regardless of their parents’ immigration status, resembles the overall population more than it does the first generation. One prominent exception is that both first- and second-generation adults are more likely than the adult population overall to live in multi-generational family households.
Both the first- and second-generation populations of adults grew about 14% from 2006 to 2012, twice the 7% growth rate for adults overall, according to data from the Current Population Survey. Since 2000, the immigrant adult population has grown 35%, and the number of second-generation adults has grown 20%. The nation’s 37 million foreign-born adults outnumber the nearly 20 million second-generation adults. Second-generation adults made up 8% of the adult population in 2012.
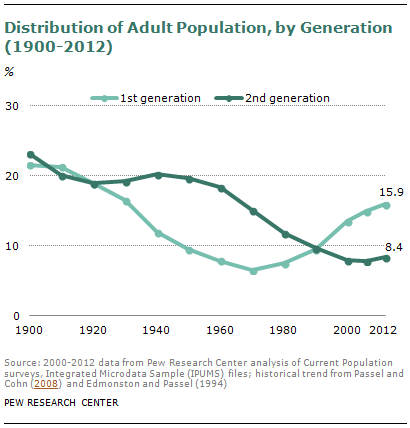
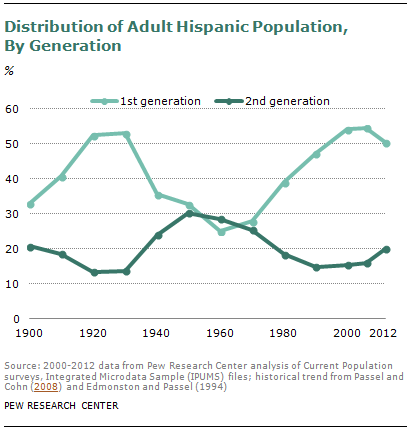
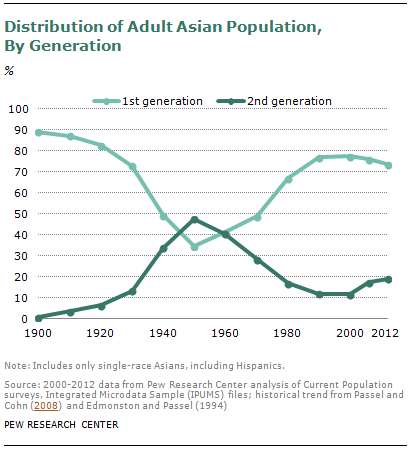
The second generation’s share of the U.S. population—children as well as adults—peaked during the early decades of the 20th century, when about 20% of U.S. residents of all ages had immigrant parents. But the relative size of the second generation began to fall as the large wave of immigration that began in the late 19th century came to an end. Immigration flows dropped steadily in the 1920s and virtually ceased during the Great Depression and World War II. By 1990, the second generation represented only 10% of the population, a 20th century low, before its share began to rise again as a result of a new immigration wave that began in the 1960s.
This report focuses on the 20 million adult children of immigrants. There also are roughly 16 million second-generation children, ages 17 and younger, for a total of 36 million second-generation residents of the U.S. Thus, as the second-generation children reach adulthood, the second generation is poised to continue as a sizable segment of the population.
Among second-generation adults, fully 35% are ages 18-29, higher than this age group’s 22% share of the overall adult population and 18% share among immigrant adults. In fact, among all 18- to 29-year-olds, second-generation adults (6.9 million) slightly outnumber those in the immigrant generation (6.8 million), the only age group for which this is so. The second-generation share of the adult population is 8%, but they represent 14% of adults ages 18 to 29.
The second generation has a smaller share of middle-aged adults—ages 30 to 64—than does the foreign-born population or overall population. Only 44% of the second generation is in this age group, compared with 68% of immigrants and 61% of all adults. But 21% are ages 65 and older, reflecting births that followed the early 20th-century influx of immigrants, mainly from Europe. By comparison, only 13% of immigrants and 18% of adults overall are ages 65 and older.
Whether all age groups or only adults are included, the current second generation has no race or ethnic majority, in contrast to the majority-white makeup of the overall population and of past waves of immigration. Among adult children of immigrants, whites account for 46%, Hispanics 35%, Asian Americans 12% and blacks 4%. The remainder of the second generation includes adults from smaller non-Hispanic race groups, such as Pacific Islanders, as well as adults who are of more than one race.
By contrast, among immigrant (first-generation) adults, 20% are white, while 47% are Hispanic, 25% Asian American and 8% black.
Hispanics and Asians represent about seven-in-ten of the nation’s adult immigrants, and their adult children will be the most prominent legacy of the current wave of immigration. The second generation makes up an important and growing share of the nation’s adult Hispanic and Asian-American populations. Among Hispanics, 20% of adults are the children of immigrants. Among Asian Americans, 19% are. The second generation makes up a smaller share of white adults (6%) and black adults (3%).
The residential pattern of the second generation is similar to that of foreign-born adults and both differ somewhat from adults overall. The West is the most likely region for the second and first generations to live—more than a third of each reside there, compared with about a quarter of adults overall. Notably lower shares of the adult children of immigrants (13%) and immigrants themselves (11%) live in the Midwest, compared with all adults (21%).
Somewhat lower shares of adult children of immigrants (27%) and immigrants (32%) live in the South, compared with adults overall (37%).
Educational Attainment
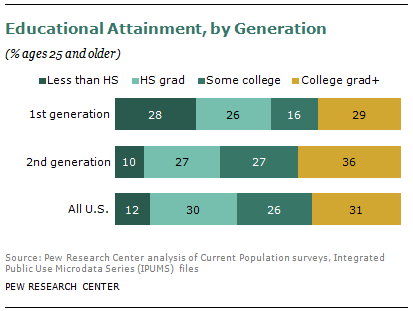
As a group, the adult children of immigrants are more highly educated than are immigrant adults and the overall population. More than a third (36%) have at least a bachelor’s degree, compared with 29% of immigrants and 31% of all adults. Second-generation adults are much more likely than immigrants to have completed high school: Only 10% have less than a high school diploma, compared with 28% of immigrants and 12% of all adults.
In comparing immigrants and the second generation, the second generation is more likely to hold at least a high school diploma not just overall but also in each age group analyzed—25 to 29, 30 to 39, 40 to 49, 50 to 64 and ages 65 and older. When it comes to having a college education, the second generation is more likely than the first to do so in each age group except for adults ages 65 and older, when both groups are equally likely to be college-educated.
Compared with the population overall, second-generation adults are at least as likely to have graduated from college in each age group. Second-generation adults in each age group are slightly less likely than the population overall to lack a high school diploma.
Among young adults, ages 18-24, the second generation and all adults have markedly lower high school dropout rates than do foreign-born young adults. Among 18- to 24-year-old children of immigrants, 7% have not completed high school and are not enrolled in school, compared with 18% of foreign-born adults of similar ages.
Economic Well-Being
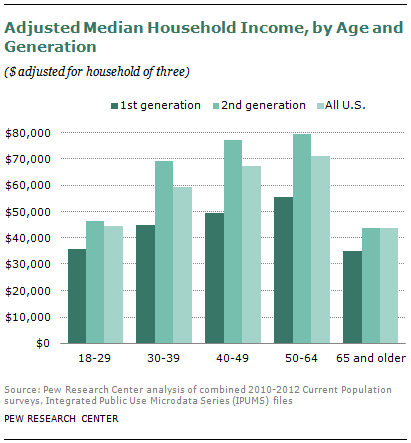
On average, the economic well-being of the second generation tracks that of the adult population overall and is higher than that of immigrants. Adult children of immigrants have a median household income of $58,100 a year, compared with $58,200 for adults overall and $45,800 for foreign-born adults.
In this report, household incomes are adjusted and standardized to a household size of three to account for differences in average household size that affect the amount of income available to each member of the household.
The overall income differences between the second generation and the total adult population are influenced by the relative youth of the second generation. For example, only 15% of second-generation adults are ages 50-64, when incomes are at their peak, compared with 26% of the total population and 23% of immigrants who are in that age group.
Among young adults, ages 18-29, differences in median adjusted household income between the second generation and overall population are relatively modest, but those differences widen in the second generation’s favor at subsequent ages, until ages 65 and older. But because the second generation is so heavily young, compared with all adults, its income profile is pulled down by the more modest incomes of its large contingent of young adults.
Compared with immigrants, the second generation has a higher adjusted median household income in all age groups, but the gap widens among adults in their 30s and older, until ages 65 and older.
Homeownership, Poverty, Insurance
Second-generation adults are more likely to own their own homes than are immigrant adults and are about as likely as the overall population to be homeowners. This pattern holds for all age groups. In 2012, the homeownership rate for second-generation householders was 64%, compared with 51% for immigrant householders and 65% for all householders.
Second-generation adults are on average less likely to be in poverty than are immigrants and slightly less likely than adults overall. The overall share in poverty for the adult children of immigrants is 11%, compared with 18% for foreign-born adults and 13% for all adults.
Among adult children of immigrants, the share in poverty for adults ages 18 to 64 is higher than that of older adults—13% compared with 6%. This pattern is similar among all adults, but the share in poverty for immigrant adults is similar in both age groups (18% for ages 18 to 64 and 16% for ages 65 and older).
About one-in-five second-generation adults (19%) do not have health insurance. That is comparable to the share of all adults who are uninsured and is notably lower than the one-in-three (34%) foreign-born adults who do not have health insurance.
Employment and Occupation
Among second-generation adults, 62% are in the labor force, compared with 68% of foreign-born adults and 65% of all adults. Of those, 9.3% of second-generation adults were unemployed in March 2012, compared with 8.6% of immigrants and 8.3% of all adults.
Many differences between the generations can largely be explained by differences in age structure. Immigrants are more likely than others to be in their 30s and 40s, the prime working ages. The second generation still has an above-average share in the 18-29 age group, many of whom are still in school, as well as an above-average share of those ages 65 and older, who are more likely to be retired from the workforce.
Compared with foreign-born adults, the second generation is more likely to be in white-collar jobs such as management or office services. They are less likely to be in service, construction, transportation or maintenance occupations.
The most common job category for all adult generations is management, professional and related occupations, which accounts for 40% of jobs held by members of the second generation but 31% of those held by immigrants. An additional 28% of second-generation adults hold sales and office support jobs, compared with 17% of immigrants. The profile for all adults is more similar to that of the second generation than foreign-born adults.
Only 14% of adult children of immigrants are employed in service occupations, compared with about a quarter of immigrants (23%) and 16% of all adults. The share of the second generation employed in occupations related to maintenance production transportation and material moving is 13%, compared with 19% for immigrants and 16% for adults overall. Construction, mining and farming jobs are held by 5% of the second generation, 10% of immigrants and 6% of adults overall.
Family and Living Arrangements
The living arrangements of second-generation adults are more similar to those of the overall population than to those of the first generation.
The second generation includes nearly equal shares of adults who are married (40%) and never married (42%), with a smaller share who are separated, widowed or divorced (18%). The married share is lower than for foreign-born adults (63%) and for all adults (54%). The never-married share is higher than for foreign-born adults (22%) and all adults (28%).
The relative youthfulness of the second generation explains much, but not all, of the difference in the share of adults who are married. Most Americans do not marry for the first time until their late 20s, and the second generation has a larger share of those in the 18-29 age group than do the immigrant or overall populations.
However, in each decade of life, adults in the second generation have a slightly lower currently married rate than the overall population. For those in their 20s and 30s, this is due to a larger share among the second generation who have never married. In later decades, this difference fades, but the second generation has a higher rate of divorce, separation or widowhood.
However, foreign-born adults are more likely to be married at each stage of life than the second generation or all adults. Among those ages 18-29, fully 32% are married, compared with 15% for the second generation and 21% for all adults. Marriage rates are higher for immigrants in each subsequent decade of life, until ages 65 and older.
One explanation for the higher marriage rates among immigrants is that many come from nations with higher marriage rates than the U.S. Data gathered by the United Nations, and analyzed for the 10 nations that are the top current sources of immigrants, indicate that most or all have higher shares of currently married adults, except among the oldest adults. Another contributing factor, in some cases, is that U.S. policies give high priority to spouses in allocating visas.8
Among those who are married, second-generation adults (17%) are more likely to have a spouse of a different race or ethnicity than are all adults (8%) or foreign-born adults (8%).
The higher overall second-generation shares are influenced by relative youth of the second generation, because intermarriage is more common among recent marriages than older ones.9 However, in each decade of life until age 65, intermarriage is more common for second-generation adults than for foreign-born adults or all adults. For example, among those in their 40s, 20% of second-generation adults have a spouse of a different race or ethnicity, compared with 8% of foreign-born adults and 9% of all adults.
Another factor explaining the larger share of second-generation adults who are intermarried is the large proportion of Asian Americans and Hispanics in this population. Both of these groups are more likely than the population overall to be married to someone of a different race or ethnicity.
Chapter 5 has additional detail on intermarriage by race, ethnic group and other demographic characteristics, as well as a discussion of attitudes about intermarriage from a Pew Research Center survey.
Looking at marriage by nativity—whether a U.S.-born adult has a foreign-born spouse or vice versa—both second-generation adults (17%) and first-generation adults (20%) have higher rates than do all adults (7%).
Second-generation adults are markedly more likely than the population overall to live in multi-generational households, with at least two adult generations or a grandparent and grandchild sharing living space. Among the adult children of immigrants, 22% live in multi-generational households, compared with 18% of the overall adult population and 24% of foreign-born adults.
The age group most likely to live in multi-generational family households is adults ages 25 to 34. In this age group, fully 33% of the second generation lives in such households, a markedly higher share than for comparably aged adults overall or immigrant adults (both 20%).
As the Pew Research Center recently reported, immigrants have accounted for a growing share of all births in recent decades,10 although that share has dipped since the onset of the Great Recession in 2007. Among women ages 15-44 in all race and ethnic groups, immigrants are more likely than second-generation women or all women in that age group to have had a birth in the past year.
Among all second-generation women ages 15-44, for example, 6% gave birth in the previous year, according to pooled Current Population Survey data for 2004-2010. That compares with 9% of similarly aged foreign-born women and 7% of all similarly aged women.
Among women ages 15-44 who gave birth in the previous year, second-generation women are more likely than foreign-born women to be unmarried. Using pooled Current Population Survey data for 2004-2010, 41% of second-generation mothers who gave birth in the previous year were not married, compared with 23% of foreign-born women and 36% of all women.11
Voting and Turnout
The adult children of immigrants accounted for 9% of eligible voters in 2010, the latest year for which numbers are available. (An eligible voter is defined as an adult U.S. citizen.) That share is slightly higher than for immigrants, who account for 8% of eligible voters. The turnout rate for second-generation adults—that is, votes cast as a share of eligible voters—was 43%, higher than the 37% turnout for foreign-born voters and lower than overall turnout of 46%.
What is the racial and ethnic makeup of second-generation eligible voters? In 2010, 49% were white, 33% Hispanic, 11% Asian American and 5% black. By comparison, whites represent 73% of all eligible voters, blacks represent 12%, Hispanics 10% and Asian Americans 4%.
The distribution of eligible voters by immigrant generation varies markedly by race and ethnic group. Among whites, only 6% of eligible voters are adult children of immigrants, and for blacks the share is 3%. However, 30% of eligible Hispanic voters are second-generation adults, as are 26% of eligible Asian-American voters.
Future Growth
The impact of the adult second generation is projected to grow rapidly in the coming decades. According to Pew Research Center projections, the adult second generation will grow 126% from 2012 to 2050, more sharply than the first generation (103%) or the adult population overall (42%). By 2050, the second generation will account for 16% of adult Americans, compared with about 8% in 2012.
The growth rate of the second generation will be even more striking among adults ages 18 to 64. From 2012 to 2050, the second generation working-age population is projected to grow 198%, compared with 83% for immigrants and 32% for adults overall. The second generation’s share of the working-age population, 8% in 2012, is projected to increase to 18% in 2050.
Among adults, immigrants will continue to outnumber the second generation in 2050, 75 million to 52 million. That also will be true for working-age adults, where the second generation will number 46 million and the immigrant generation 59 million.
Racial and Ethnic Portraits by Generation
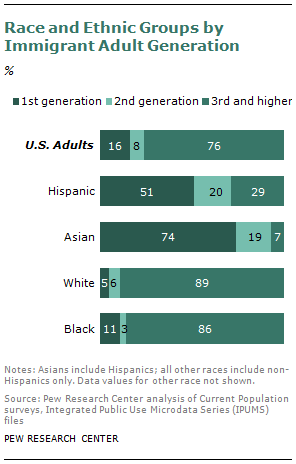
This section examines each four major race and ethnic groups—Hispanics, Asians, whites and blacks—and focuses in particular on the second generation, the adult children of immigrants. The different timing of their waves of immigration affects the size of their generations. Among blacks and whites, for example, nearly nine-in-ten adults were born in the U.S. to U.S.-born parents. The great wave of white immigration happened a century ago; for blacks, a wave of voluntary immigration began only in recent decades.
The Hispanic and Asian populations are more dominated by immigrants, although the U.S.-born population is catching up among Hispanics. In both groups, a large influx of immigration began in the 1960s. Hispanics and Asians represent the future of the second generation. Although just under half of second-generation adults are Hispanic or Asian, these two groups account for more than seven-in-ten foreign-born adults.
Third Generation
The third-and-higher generation is the dominant group in the white population, accounting for nearly nine-in-ten adults. This also is true of the black population, where 86% of adults are the U.S.-born children of U.S.-born parents.
The third-and-higher generation among Asian-American adults is small—only 7% of the total—reflecting the long period of U.S. restrictions on immigrants from the Far East, Southeast Asia and the Indian subcontinent.
Among Hispanics, third-and-higher generation adults are not generally the grandchildren of recent immigrants—as proof, note that their median age (39) is only slightly lower than that of the first generation (41). They are more likely to be descendants of families that came from Latin America many generations ago. In some cases, they would have been living in U.S. territories when those areas were incorporated into the nation as new states.
Hispanic Second Generation
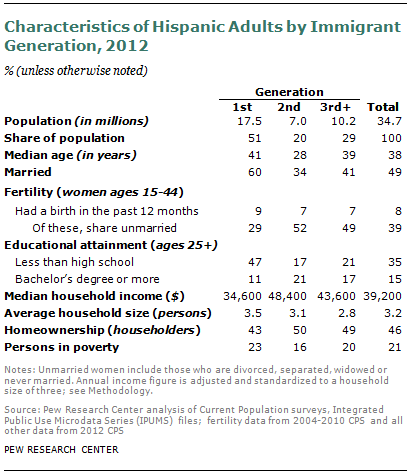
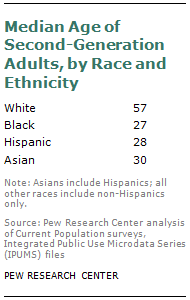
Among adult Hispanics, 20% are the children of immigrants and 51% are foreign born. The second generation is notably young, with a median age of 28, compared with 41 for Hispanic immigrants and 38 for Hispanic adults overall. Among second-generation Hispanics, 53% are ages 18-29 and only 6% are ages 65 and older.
Among all Hispanics, including children as well as adults, 31% are the children of immigrants and 36% are foreign born. Among this total second generation, 57% are younger than 18.
The Hispanic second generation is mainly the product of mass immigration from Latin America that began in the 1960s. By the 1980s, the number of Hispanic immigrant adults had surpassed the number of Hispanics from the third-and-higher generations, including some whose families had lived in the U.S. for more than a century.
About half of the 44 million immigrants who have come to the U.S. since 1965 are from Latin America. That flow has been dominated by the 12 million immigrants from Mexico, who account for more than half of Hispanic immigrants and about 30% of all U.S. foreign-born residents.12 But seven other Latin American nations also are among the top 20 source countries of the nation’s foreign-born population: El Salvador, Cuba, the Dominican Republic, Guatemala, Colombia, Honduras and Ecuador.
The Hispanic immigrant population is a mix of cultures, histories and characteristics. It includes refugees who fled their countries because of political repression, natural disasters or other reasons, as well as highly trained professionals. But it is dominated by the large influx of immigrants from Mexico, who are disproportionately low-educated and unauthorized. Hispanic unauthorized immigrants account for three-quarters of the U.S. unauthorized population and about 45% of Hispanic immigrants, according to a Pew Research Center analysis of government data.13
Immigrants make up about half of the Hispanic adult population. Since the 1970s, immigration had been the dominant force in Hispanic population growth, but over the past decade, births—especially to immigrants—have become the major driver.14
Fueling this trend is the fact that Hispanic immigrants not only are more likely than the U.S. population overall to be in their prime child-bearing years, but also have higher fertility.15 In addition, Hispanic immigration levels, especially from Mexico, have fallen since 2006.
As a result, the number of U.S.-born adult Hispanics has grown to nearly equal the number of adult Hispanic immigrants.
Educational Attainment
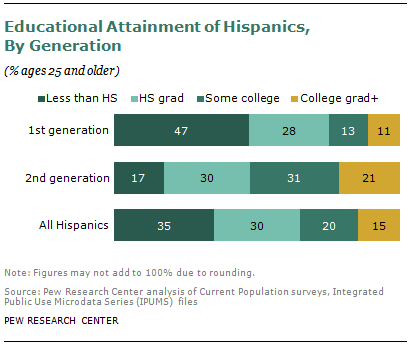
Second-generation Hispanics are better educated in general than immigrant Hispanics. About one-in-five (21%) has a college degree or more, compared with 11% of foreign-born Hispanics.
Among second-generation adults, 17% do not have a high school diploma, compared with 47% of foreign-born Hispanics.
The second generation of Hispanics is more educated than Hispanic adults overall. The share of second-generation Hispanics with at least a college degree exceeds that of Hispanics overall (and matches or betters the third-and-higher generation).16
Economic Well-Being
Household incomes of second-generation Hispanic adults are higher than those of immigrant Hispanics and all Hispanic adults. Median household income, adjusted to a household size of three, was $48,400 in 2012 for second-generation adults, compared with $34,600 for immigrant Hispanics and $39,200 for all Hispanic adults.
Half of Hispanic second-generation householders own their own homes. This rate is higher than the 43% homeownership rate for immigrant Hispanic householders and the 46% rate for all Hispanic householders.
Second-generation Hispanic adults are less likely than immigrant Hispanic adults or Hispanic adults overall to be poor. In 2012, 16% of second-generation adults were poor, compared with 23% of immigrants and 21% of Hispanic adults overall. Shares in poverty also are lower for Hispanic second-generation adults within two age subgroups—adults ages 18 to 64 and those ages 65 and older.
About a third (32%) of second-generation Hispanic adults do not have health insurance. That uninsured rate is lower than it is for foreign-born Hispanic adults, about half (49%) of whom do not have insurance. It also is lower than the 38% uninsured rate for Hispanic adults overall.
Second-generation Hispanic adults are as likely to be in the labor force as Hispanic adults overall (69% each) and slightly less likely than immigrant Hispanics (71%).
Family and Living Arrangements
Among Hispanic adults, the younger second generation is notably less likely to be married (34%) than immigrant Hispanics (60%) or Hispanics overall (49%). Most (54%) have never married, compared with 25% of immigrants and 35% of Hispanics overall. Second-generation adults are slightly more likely than foreign-born adults to be living with an unmarried partner (9% compared with 7%).
A third of Hispanic second-generation adults (33%) who are married have a spouse who is foreign born. By contrast, only 17% of married immigrant Hispanic adults have a U.S.-born spouse.
Fully 46% of second-generation Hispanic householders have dependent children living with them, compared with 54% for immigrants and 49% for Hispanic householders overall.
Among Hispanics, 30% of second-generation adults live in multi-generational family households, somewhat higher than the 26% of the Hispanic adult immigrant population or overall population who do so. Looking at 25- to 34-year-olds, 37% of Hispanic children of immigrants live in multi-generational households, compared with 19% of comparably aged Hispanic immigrants and 25% of all comparably aged Hispanics.
Among Hispanic women ages 15-44, 7% of the second generation gave birth in the previous year, compared with 9% of foreign-born women and 8% of Hispanic women overall. Half (52%) of second-generation Hispanic women who gave birth in recent years were unmarried, compared with 29% for immigrant Hispanic women and 39% for Hispanic women overall.
Asian-American Second Generation
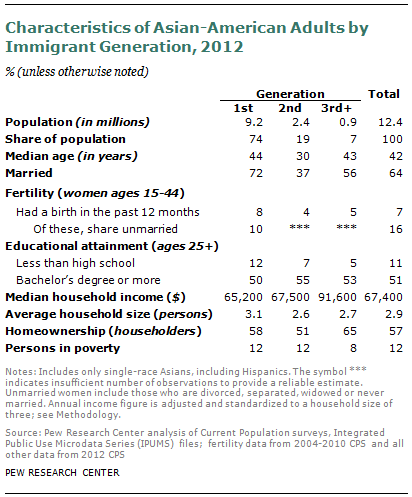
Among adult Asian Americans, 19% have immigrant parents and 74% are immigrants themselves. The Asian-American adult second generation is notably young, with a median age of 30. Among this group, 48% of adults are ages 18-29, compared with 17% of immigrant Asian Americans and 23% of Asian Americans overall. Only 8% are ages 65 and older.
Among all Asian Americans, both children and adults, the second generation accounts for 30% of population, and immigrants make up 62%. About half (51%) are younger than 18.
The modern immigration wave from Asia, like that from Latin America, dates back to the 1960s. Until then, immigration restrictions had held down the size and growth of the Asian-American population. Asian immigrants represent about a quarter of the nation’s total immigrant population. Although they are far outnumbered by Hispanics in the U.S. foreign-born population, Asians have outnumbered Hispanics since at least 2009 among new immigrant arrivals because of a slowdown in immigration from Latin America.17
Although Asian immigrants come from dozens of nations in the Far East, Southeast Asia and the Indian subcontinent, 82% come from six countries: China, the Philippines, India, Vietnam, South Korea and Japan, according to the 2011 American Community Survey.
Immigrants account for about three-quarters of the Asian-American adult population, and therefore dominate it to a greater extent than is true for Hispanics, where immigrants are half the adult population. Among major Asian-American groups, only the Japanese are majority U.S.-born. Among Asian-American adults, the second generation outnumbers the third-and-higher generation, in contrast to the pattern of third-generation dominance among Hispanics and other racial groups.
As is true of other groups, Asian-American immigrants arrive in the U.S. through varied pathways. Most, as is true of immigrants overall, arrive on family-sponsored visas. But Asian immigrants are more likely than those from other regions to be admitted on employment visas. This is especially true of Korean and Indian immigrants, about half of whom received green cards in 2011 based on employer sponsorship. Among major subgroups, the Vietnamese are the only population to have come in large numbers as political refugees, but smaller influxes from other Asian nations also arrived with refugee status.18
About 10-11% of the U.S. unauthorized immigrant population is made up of Asian-American immigrants, and about 13-15% of the Asian-American immigrant population during the 2000-2010 decade was unauthorized, according to a Pew Research Center analysis of government data.19
Educational Attainment
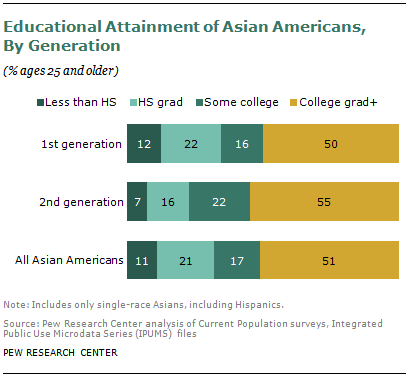
Among those ages 25 and older, second-generation Asian-American adults are, on average, slightly better educated than immigrants and the overall population. More than half (55%) have at least a college education, compared with 50% of immigrants and 51% of the overall Asian-American population. Only 7% have not completed high school, compared with 12% of immigrants and 11% of the total Asian-American population.
Among those ages 18 to 24, the difference is even smaller on high school completion—3% of the second generation and overall adults have not completed high school, compared with 4% of immigrants.
Economic Well-Being
Despite their younger median age, second-generation Asian-American adults have a median household income, adjusted to a household size of three ($67,500), that is comparable to that of all Asian-American adults and slightly higher than incomes of Asian-American immigrants ($65,200).
The homeownership rate for second-generation Asian-American householders is 51%, lower than the 58% rate for immigrants and 57% rate for overall adults. However, this appears to be a function of their younger age profile. For each age group, the second-generation homeownership rate is at least as high as that of the immigrant or overall Asian-American adult populations.
Among second-generation Asian-American adults, the 12% share in poverty is similar to that for all adults and immigrants. However, among Asian Americans ages 65 and older, the share is somewhat lower for the second generation (7%), compared with immigrants (13%) and adults overall (12%).
About one-in-five second-generation adults do not have health insurance, which is similar to the rate for immigrant adults and all adults among Asian Americans.
Among Asian Americans, nearly two-thirds of second-generation adults (63%) are in the labor force, comparable to all adults and immigrant adults (65%). Their unemployment rate is somewhat higher, however, perhaps reflecting their younger age profile, since younger adults (ages 18-29) are more likely to be unemployed than older ones.
Among Asian-American adults, the second generation is less likely than immigrants to be employed in service occupations and more likely to work in sales and office support. The second generation of Asian-American adults also is slightly less likely than immigrants to be employed in maintenance, production, transportation and material moving jobs. Second-generation adults are somewhat more likely to work in the information and finance industries, and less likely to work in the manufacturing industry, compared with immigrant Asian Americans.
Family and Living Arrangements
Among the second generation, a greater share of adults have never been married (56%) than are currently married (37%), the opposite of the pattern for Asian-American adults overall and immigrant Asian Americans. This reflects the younger age profile of the second generation (26%).
Among Asian Americans, 29% of second-generation adults live in multi-generational family households, slightly higher than the 27% of foreign-born Asian Americans and 27% of all Asian Americans who do. Among 25- to 34-year-old Asian Americans, 39% of the second generation live in multi-generational family households, compared with 23% of immigrants and 28% of the total population in this age group.
Among Asian-American women ages 15-44, 4% of the second generation had a birth in the previous year, compared with 8% of immigrants and 7% of the total population. There is not enough data to make comparisons by generation for births to unmarried mothers.20
White Second Generation
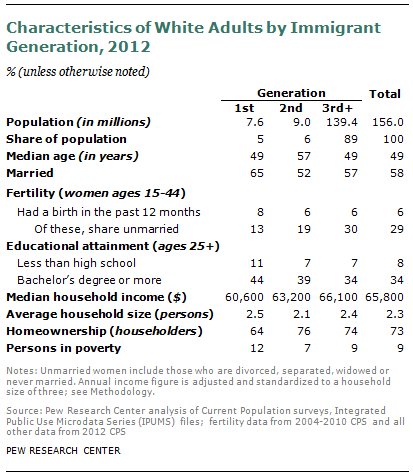
Among white adults, 6% are the children of immigrants and 5% are immigrants themselves. White second-generation adults are notably older than other second-generation adults, with a median age of 57, which is eight years older than white adults overall or white foreign-born adults. In the other major race and ethnic groups, the second generation is notably younger than the first generation.
White second-generation adults are concentrated in the older age groups: Only 15% are ages 18 to 29, while 61% are ages 50 and older.
Among the total white population, 6% are the children of immigrants and 4% are foreign born. Only 23% of the white second generation is younger than 18, and 30% are ages 65 and older.
The adult second generation of whites mainly is a legacy of the great wave of European immigration in the late 19th and early 20th centuries. From 1890 to 1919, 18 million immigrants arrived, including 11.4 million from southern and eastern European nations.
The largest source of current white immigrants are the former republics of the Soviet Union, which account for about 1 million current U.S. immigrants (see table in Overview). Also among the top 20 source countries for the U.S. foreign-born population are Canada (676,000), the United Kingdom (642,000) and Germany (537,000), most of whose immigrants are white.
Educational Attainment
The white second-generation population is well educated, compared with the population overall: 39% have at least a college degree, and only 7% have less than a high school education. Among whites, second-generation adults are slightly more likely than all adults and slightly less likely than foreign-born adults to be college-educated.
Economic Well-Being
Household incomes of second-generation white adults are slightly higher than those of foreign-born white adults and slightly lower than those of all white adults. Median household income, adjusted to a household size of three, is $63,200 for second-generation adults, compared with $60,600 for immigrants and $65,800 for all white adults.
The homeownership rate among white second-generation householders is 76%. That is similar to the rate among all white householders and higher than the 64% homeownership rate for foreign-born white householders. The high share of homeownership among white second-generation adults reflects in part their older age structure. The homeownership rate rises with age, and well over half of second-generation white adults are ages 50 and older.
The share in poverty for second-generation white adults is quite low, only 7%. That share is similar to that in the overall white adult population and five percentage points lower than among white immigrants.
Only 9% of white second-generation adults have no health insurance, which is comparable to the rate among all white adults and lower than the 18% uninsured rate among white immigrant adults.
Among white second-generation adults 54% are in the labor force, a lower participation rate than for all white adults (65%) or for foreign-born white adults (61%), due largely to their older age profile. For those in the labor force, their unemployment rate in March 2012 (6.6%) was lower than that of all adults or immigrants, among whites.
Among whites, there are not notable differences in the occupation or industry patterns of second-generation adults, compared with all adults or immigrant adults.
Family and Living Arrangements
The living arrangements of older second-generation whites reflect their older age profile. About half (52%) are currently married, while 26% are divorced, separated or widowed. Both these shares are lower than for all white adults or white immigrant adults. Second-generation white adults also are notably less likely to have dependent children living at home than either all white adults or foreign-born adults. Only 19% do.
Among whites, 14% of second-generation adults live in a multi-generational family household, the same share as in the population overall and roughly similar to the share among immigrants (16%). Among adults ages 25 to 34, the second generation is notably more likely to live in a multi-generation household: 23%, compared with 14% of immigrants 16% among the overall population.
Among white second-generation women ages 15-44, 6% gave birth during the previous year, similar to the share of all white women in that age group but lower than the 8% share of immigrants. About one-in-five (19%) white second-generation women who gave birth were unmarried, compared with 29% of all white women who gave birth and 13% of white immigrant women who gave birth.
Black Second Generation
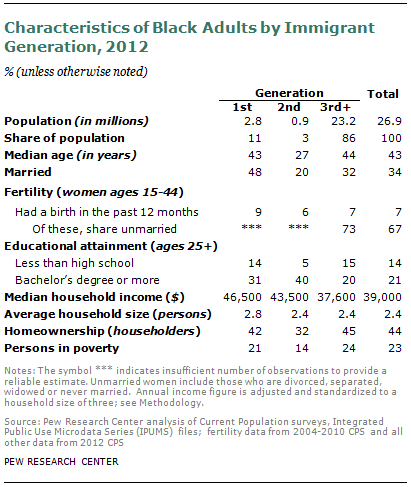
The black second generation represents a smaller slice of the overall black adult population than of other major racial and ethnic groups. Only 3% of adults have immigrant parents; 11% of adults are themselves immigrants.
The median age of the black adult second generation is quite young—only 27. Among second-generation adults, most (57%) are ages 18-29. Only 5% are ages 65 and older, compared with 11% and 13% of the first generation and all black adults.
The relative youth of this group, with a younger median age than Asian Americans, Hispanics or whites, helps explain its economic well-being and living arrangements.
In the overall black population, including both adults and children, the second generation also represents a small share of the total, only 5%.
Although the U.S. has a large black population as a legacy of slavery, voluntary black immigration began relatively recently.21 Most black immigrants during 2008-2009 were from the Caribbean (1.7 million) or Africa (1.1 million).
Voluntary immigration from the Caribbean ticked up after the Spanish-American War ended in 1898 and widened after passage of 1965 federal legislation opened immigration pathways from a greater variety of countries. Most black Caribbean immigrants come from Jamaica, Haiti, Trinidad and Tobago, and the Dominican Republic.22
Most are admitted on family visas, but at least 7% are refugees for various reasons, including Cubans, Dominicans and Haitians. About 16% of Caribbean immigrants were unauthorized in 2006-2008. Most Caribbean immigrants come from a country where English is spoken, which gives them an advantage in the job market upon arrival.
Immigration from Africa was sparse until late in the 20th century. No single country dominates the flow; the largest source country, Nigeria, accounted for 19% of black African immigrants in 2009.
Black Africans are more likely than other groups to be admitted as refugees or under a diversity visa program intended to expand immigration from underrepresented groups. African immigrants are more likely than other groups (or the U.S. born) to have graduated from college. About 21% of African immigrants are unauthorized.
Immigrants from Africa were among the fastest-growing groups within the U.S. foreign-born population from 2000 to 2009. If current trends continue, some analysts predict that Africa will replace the Caribbean by 2020 as the major source of black immigration to the U.S.
Educational Attainment
The educational attainment of black second-generation adults is high, especially compared with black adults overall, and is somewhat higher than for black immigrants. Four-in-ten (40%) have at least a college degree and only 5% have not completed high school. Among black immigrants, 31% have completed college and 14% have less than a high school diploma. Among all black adults, 21% have completed college and 14% have less than a high school diploma.
Economic Well-Being
Despite their relative youth, second-generation black adults have higher median incomes than all black adults, though lower incomes than adult immigrants. Their median household income, adjusted to a household size of three, $43,500, compares with $39,000 for all black adults and $46,500 for black immigrant adults.
Only about a third of second-generation black adult householders (32%) are homeowners, lower than the rate for black immigrants (42%) or all black householders (44%). This difference is due in part to the youth of the second generation; more than half are ages 18 to 29, and homeownership peaks at older ages. Compared with immigrant (11%) and all black adults (15%) ages 18 to 29, second-generation black adults (17%) have a somewhat higher homeownership rate.
The share in poverty for black second-generation adults is lower than that of first-generation adults or of all adults.
The second generation is as likely as all black adults not to have health insurance (23% do not), though somewhat more likely than immigrant black adults (28% of whom do not have health insurance.)
Second-generation black adults are somewhat less likely to be in the labor force than immigrant adults—66% to 72%. Their unemployment rate—15.7% in March 2012—was higher than that of immigrants (11.6%).
In terms of occupation, patterns for the second generation resemble more closely that of immigrants than of black adults overall. About four-in-ten (41%) work in management, professional or related jobs, 24% work in sales and office support and 21% hold service employment.
Family and Living Arrangements
Only 20% of second-generation black adults are married and 69% have never married, as might be expected of such a young population. In the first generation 48% are married and 33% have never married. Among all black adults, 34% are married and 43% have never married.
Among black second-generation adults, 34% live in multi-generational households, higher than the shares for immigrants (26%) and the overall population (26%). Among 25- to 34-year-olds, an estimated 42% of black children of immigrants live in multi-generation family households, compared with 26% of immigrants and 28% of the total population in this age group.
Among black women ages 15-44, 6% of second-generation women gave birth during the previous year, compared with 9% of immigrant women and 7% of all women. Insufficient data are available to calculate the share of births to unmarried mothers for second-generation black women.23


