After running up record debt-to-income ratios during the bubble economy of the 2000s, young adults shed substantially more debt than older adults did during the Great Recession and its immediate aftermath—mainly by virtue of owning fewer houses and cars, according to a new Pew Research Center analysis of Federal Reserve Board and other government data.
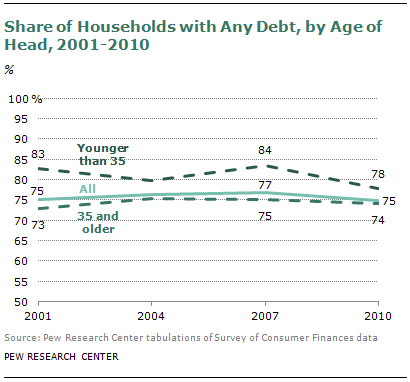
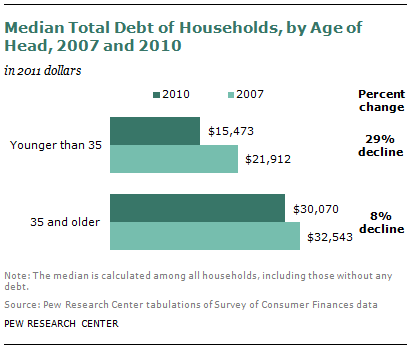
From 2007 to 2010, the median debt of households headed by an adult younger than 35 fell by 29%, compared with a decline of just 8% among households headed by adults ages 35 and older. Also, the share of younger households holding debt of any kind fell to 78%, the lowest level since the government began collecting such data in 1983.
Debt reduction among young adults during bad economic times has been driven mainly by the shrinking share who own homes and cars, but it also reflects a significant decline in the share who are carrying credit card debt, from 48% in 2007 to 39% in 2010.
On the other side of the ledger, many more younger households were carrying student loan debt after the recession than before: 40% had such debt in 2010, up from 34% in 2007 and 26% in 2001.
These shifts in the debt profile of younger adults reflect a broader societal shift toward delayed marriage and household formation that has been under way for decades. This report analyzes the patterns of debt holding and asset ownership among younger households over time.1 Here are its key findings:
Home
The share of younger households owning their primary residence fell sharply from 40% in 2007 to 34% in 2011. Among younger households, the fall in ownership was accompanied by a decline in how many younger households had debt secured by residential property.2 In 2007, 38% of younger households had debt secured by residential property. By 2010 only 35% had such debt. The median outstanding amount of residential property debt owed (by younger households with such debt) fell from about $150,000 in 2007 to $128,000 in 2010.
Cars
In 2007, 73% of households headed by an adult younger than 25 owned or leased at least one vehicle. By 2011, 66% of these young households had a vehicle. Among households younger than 35, outstanding vehicle debt declined from 2007 to 2010. In 2007, 44% of households younger than 35 had vehicle debt. By 2010, only 32% had vehicle debt. The typical outstanding amounts owed among young households with vehicle debt fell from $13,000 in 2007 to $10,000 in 2010.
Credit Card
Younger households have pared their credit card balances. In 2010 only 39% of them carried a balance, down from 48% in 2007 and 50% in 2001. The median outstanding amount owed among younger households with balances has fallen over the decade from $2,500 in 2001 to $2,100 in 2007 and diminishing further to $1,700 in 2010.
Student Loans
Student debt was the only major type of debt to increase in prevalence among young households during the recession. In 2007, 34% of young households had outstanding student debt. By 2010, 40% of younger households had student debt. However, the median amount owed by households with student debt fell from $14,102 in 2007 to $13,410 in 2010.
Debt-to-Income Ratios
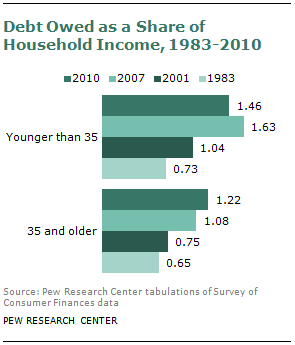
One way to measure a household’s financial well-being is its debt-to-income ratio, which compares total outstanding debt to annual income. As the figure to the right indicates, the debt-to-income ratio of younger adult households more than doubled from 1983 to 2007, when it peaked at 1.63. By 2010 it had fallen back to 1.46. By contrast, the ratio among older households continued rise through this entire period. As of 2010 it has risen to 1.22, still below that of younger households.
Concentration of Young Adult Debt
A significant majority of the outstanding debt of households headed by young adults was owed by households with college-educated heads. This partly reflects that better-educated households were more likely to owe student debt, but they were also much more likely to own their homes and have debt secured by residential property.
Younger and Older Households
During the Great Recession, households headed by younger and older adults were on different debt trajectories. From 2007 to 2010, the median debt of households headed by those 35 and older fell by just 8% — from $32,543 in 2007 to $30,070 in 2010 — compared with a 29% drop among younger households. The share of older households having any kind of debt declined slightly, from 75% in 2007 to 74% in 2010, as did the homeownership rate of older households. In 2011, 72% of older households owned their principal residence, down from 74% in 2007. But there has been very little change in the share of older households that have debt secured by a residential property, or the median amount of such debt.
With regard to other types of debt, older households have shed less than younger households. The prevalence of vehicle debt fell from 32% in 2007 to 30% in 2010 among older households, compared with a 12 percentage point drop among younger households. The share of older households carrying a credit card balance declined from 45% in 2007 to 40% in 2010, while the share among younger households dropped by 10 percentage points.
Debt Profile by Age
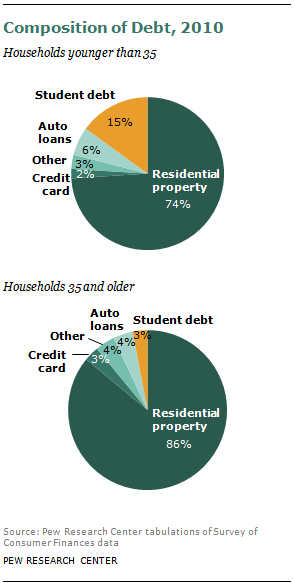
The recession did not significantly alter the overall debt profile of households 35 and older. In both 2007 and 2010, 86% of all their debt was secured by residential property. But among younger households, the debt profile has shifted. Student debt is a growing share of their total debt (rising from 9% in 2007 to 15% in 2010), and debt tied to residential property and vehicle and credit card debt have become relatively less important. Debt tied to residential property constituted 74% of the debt of young households in 2010, down from 79% in 2007.
Financial and Non-Financial Assets
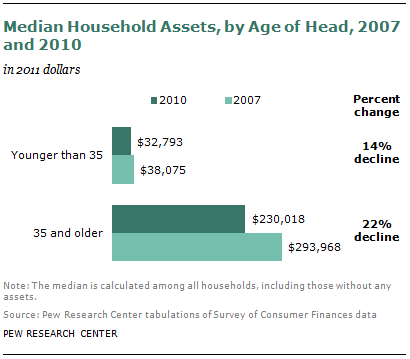
Younger and older adults both saw their median household assets – which includes homes, cars and other durable goods, plus all financial assets such as savings accounts and stock holding — decline from 2007 to 2010. Older adults have many times more assets overall than younger adults, and they suffered steeper asset declines during this period – a 22% drop, compared with 14% among younger adults. One reason for the difference is that older adults have more of their assets in financial holdings, and stock market valuations took a steep downturn from 2007 to 2010. Since then, the stock market has regained virtually of all its losses, while the housing market in most of the country has remained well below its historic peak.
About the Report
With the exception of Chapter 2, the focus of the report is on the characteristics of households, classified by the age of the head of the household. Most data on homeownership and vehicle ownership, as well as liabilities, are organized around what the household owns, not what the individual owns.
The analysis of household debts utilizes the Federal Reserve Board’s Survey of Consumer Finances; 2010 is the most recent year available. The homeownership tallies are based on the American Community Survey. Vehicle ownership relies on the Consumer Expenditure Survey. The analysis of recent mover households uses the American Housing Survey. These surveys are described in greater detail in Appendix B.
The report emphasizes trends in indebtedness and acquisition at the time points of 2001, 2010 or 2011, and occasionally 1983. To some extent the choice of time periods reflects data availability. However, the time periods are desirable due to the fact that they are roughly comparable points in the business cycle. Business cycle troughs occurred in November 1982, November 2001 and June 2009, according to the National Bureau of Economic Research. So the 1983 and 2001 periods occurred at the close of recessions. Admittedly, 2010 and 2011 occurred during a cyclical upswing, but many observers assess the recovery as less than vigorous. For example, the for-sale housing market continued to be depressed through much of 2011 (Joint Center for Housing Studies, 2012).The 2007 time point was near a cyclical peak as the National Bureau of Economic Research dates the peak at December 2007.
Throughout the report a “young adult” refers to a person at least 18 years old and younger than 35. A “young adult household” refers to a household headed by a person younger than 35 (including a small number of households with heads younger than 18).
Dollar amounts are adjusted for inflation and reported in 2011 dollars. The inflation adjustment utilizes the Bureau of Labor Statistics’ Consumer Price Index Research Series (CPI-U-RS) as published in DeNavas-Walt, Proctor and Smith (2012). This is the price index series used by the U.S. Census Bureau to deflate the data it publishes on household income.
This report was written by senior economist Richard Fry. Paul Taylor, executive vice president of the Pew Research Center, assisted the writing of the overview and provided guidance on the scope of the project. Research assistant Eileen Patten provided expert assistance with the preparation of charts and formatting the report. Patten and research assistant Ana Gonzalez-Barrera number-checked the report. It was copy-edited by Marcia Kramer.


