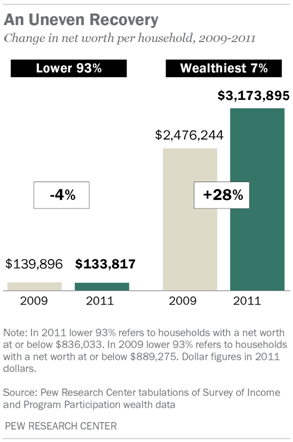
During the first two years of the nation’s economic recovery, the mean net worth of households in the upper 7% of the wealth distribution rose by an estimated 28%, while the mean net worth of households in the lower 93% dropped by 4%, according to a Pew Research Center analysis of newly released Census Bureau data.
From 2009 to 2011, the mean wealth of the 8 million households in the more affluent group rose to an estimated $3,173,895 from an estimated $2,476,244, while the mean wealth of the 111 million households in the less affluent group fell to an estimated $133,817 from an estimated $139,896.
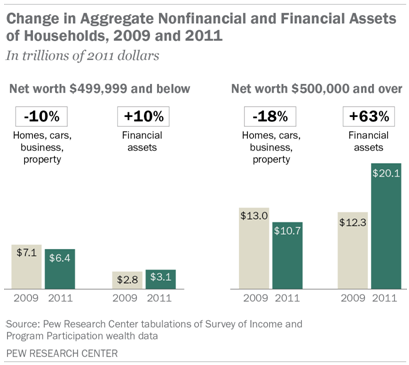
These wide variances were driven by the fact that the stock and bond market rallied during the 2009 to 2011 period while the housing market remained flat.
Affluent households typically have their assets concentrated in stocks and other financial holdings, while less affluent households typically have their wealth more heavily concentrated in the value of their home.
From the end of the recession in 2009 through 2011 (the last year for which Census Bureau wealth data are available), the 8 million households in the U.S. with a net worth above $836,033 saw their aggregate wealth rise by an estimated $5.6 trillion, while the 111 million households with a net worth at or below that level saw their aggregate wealth decline by an estimated $0.6 trillion.1
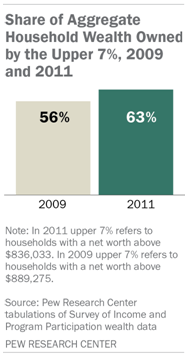
Because of these differences, wealth inequality increased during the first two years of the recovery. The upper 7% of households saw their aggregate share of the nation’s overall household wealth pie rise to 63% in 2011, up from 56% in 2009. On an individual household basis, the mean wealth of households in this more affluent group was almost 24 times that of those in the less affluent group in 2011. At the start of the recovery in 2009, that ratio had been less than 18-to-1.
(The focus in this report on the upper 7% of households rather than some other share of high wealth households reflects the limits of the tabulations published by the Census Bureau.The boundaries of its wealth categories dictated the split of households analyzed in this report.)
Overall, the wealth of America’s households rose by $5 trillion, or 14%, during this period, from $35.2 trillion in 2009 to $40.2 trillion in 2011.2 Household wealth is the sum of all assets, such as a home, car, real property, a 401(k), stocks and other financial holdings, minus the sum of all debts, such as a mortgage, car loan, credit card debt and student loans.
During the period under study, the S&P 500 rose by 34% (and has since risen by an additional 26%), while the S&P/Case-Shiller home price index fell by 5%, continuing a steep slide that began with the crash of the housing market in 2006. (Housing prices have slowly started to rebound in the past year but remain 29% below their 2006 peak.)
The different performance of financial asset and housing markets from 2009 to 2011 explains virtually all of the variances in the trajectories of wealth holdings among affluent and less affluent households during this period. Among households with net worth of $500,000 or more, 65% of their wealth comes from financial holdings, such as stocks, bonds and 401(k) accounts, and 17% comes from their home. Among households with net worth of less than $500,000, just 33% of their wealth comes from financial assets and 50% comes from their home.
The Census Bureau data also indicate that among less affluent households, fewer directly owned stocks and mutual fund shares in 2011 (13%) than in 2009 (16%), meaning a smaller share enjoyed the fruits of the stock market rally. Likewise, fewer had individual retirement accounts (IRAs) or Keogh accounts (22% in 2011 versus 24% in 2009) and the same share had 401(k) or Thrift Savings Plan accounts (39% in both years). Among affluent households, there was also a decline in the share directly owning stock and mutual fund shares during this period (59% in 2011 versus 62% in 2009), but a slight increase in the share with IRAs or Keogh accounts (70% versus 68%) and a larger increase in the share with 401(k) or Thrift Savings Plan accounts (65% versus 61%).
Overall, net worth per household in the U.S. in 2011 made up nearly all the ground it had lost since 2005—$338,950 versus $340,252 in 2005, the latest pre-recession data published by the Census Bureau. (Total household wealth doubtless rose for a period after 2005 before falling precipitously during the Great Recession of 2007-2009 and rebounding since then. However, no household wealth data are available from the Census Bureau for the years between 2005 and 2009, so it is not possible to pinpoint when, or at what level, the peak in wealth per household occurred.)
Looking at the period from 2005 to 2009, Census Bureau data show that mean net worth declined by 12% for households as a whole but remained unchanged for households with a net worth of $500,000 and over. Households in that top wealth category had a mean of $1,590,075 in wealth in 2005, $1,585,441 in 2009 and $1,920,956 in 2011.3
About the Report
Much of the original analysis in this report is based on published tabulations of household wealth and asset ownership by the U.S. Census Bureau. Estimates of the 2011 level and composition of household wealth were released by the Census Bureau on March 21, 2013. The data can be downloaded from here. The Census Bureau’s wealth tabulations are based on its long-running longitudinal household survey called the Survey of Income and Program Participation (SIPP). The Census Bureau has published comparable wealth tabulations based on SIPP since 1984 (the data were collected in 1984; the report publication date was July 1986). SIPP is among the nation’s most prominent sources of data on the wealth of American households. The Board of Governors of the Federal Reserve System also publishes periodic estimates of the aggregate net worth of the nation’s households and nonprofit organizations. The most recent Federal Reserve System estimates are for the fourth quarter of 2012. However, these “flow of funds accounts” estimates provide no demographic information; that is, they do not illuminate which households own the nation’s wealth, only the total amount of that wealth. SIPP provides detailed demographic information on the ownership of wealth, and the 2011 wealth estimates provided by the Census Bureau are the most recent estimates available on which households own the nation’s wealth.4 The estimates are based on responses from a sample of the population and may differ from the actual values because of sampling variability and other factors.
The terms “wealth” and “net worth” are used interchangeably. “Household net worth” refers to the value of the household’s assets minus the value of household liabilities, or the value of what it owns minus the value of what it owes. “Net worth” includes the value of nonfinancial assets owned, such as equity in one’s own home and a motor vehicle, as well the value of financial assets such as bank accounts, defined-contribution retirement accounts, savings bonds and directly owned stocks, bonds and securities. Net worth as measured by the Survey of Income and Program Participation does not include the value of traditional pensions (defined-benefit retirement plans) or present or future benefit streams tied to Social Security.
Unless otherwise noted, dollar amounts are adjusted for inflation and reported in 2011 dollars. The inflation adjustment utilizes the Bureau of Labor Statistics’ Consumer Price Index Research Series (CPI-U-RS) as published in DeNavas-Walt, Proctor and Smith (2012). This is the price index series used by the U.S. Census Bureau to deflate the data it publishes on household income. Additional details on the Census Bureau wealth estimates are provided in the Appendix.
This report was conceived and researched by Richard Fry, senior economist with the Pew Research Center’s Social & Demographic Trends project. The report was written by Fry and Paul Taylor, executive vice president of the Pew Research Center and director of the Social & Demographic Trends project. Research assistant Eileen Patten provided expert assistance with the preparation of charts and formatting the report. Research assistants Patten and Anna Brown number-checked the report. It was copy-edited by Marcia Kramer. The authors appreciate the insights on the distribution of wealth provided by Rakesh Kochhar, senior researcher with the Pew Research Center.


