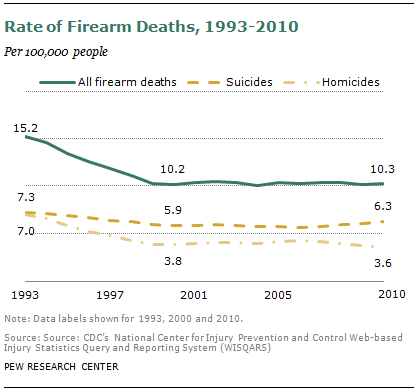
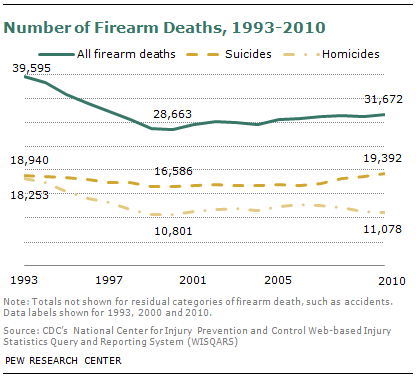
In 2010, there were 31,672 deaths in the U.S. from firearm injuries, mainly through suicide (19,392) and homicide (11,078), according to CDC compilation of data from death certificates.6 The remaining firearm deaths were attributed to accidents, shootings by police and unknown causes. The gun homicide rate in 2010 was the lowest it had been since CDC began publishing data in 1981. Other homicide data, from the FBI’s Uniform Crime Report (Cooper and Smith, 2011), indicate that homicide rates are as low now as they were in the 1960s.
The U.S. gun homicide rate and number of homicide victims plunged during the 1990s, but there has been little change since the end of that decade. From 1993 to 2000, the death rate dropped 45%, and the number of victims killed each year fell by nearly 7,500. From 2000 to 2010, the death rate declined 7%, and the number of victims did not change much.7
Still, due in part to recent increases in the number of suicides, firearm homicide accounted for 35% of firearm deaths in 2010, the lowest share since 1981, the first year for which the CDC published data.
The gun suicide rate has declined far less than the gun homicide rate since the mid-1990s; the gun suicide rate began rising in recent years, and the number of victims is slightly higher than two decades ago. See the textbox at the end of this section for more detail.
Firearms were used in 68% of homicides in 2010, according to CDC data. That share has ranged from 64% to 71% since the 1990s.8 In 2010, firearm homicide was the fifth leading cause of violent death, after motor vehicle deaths, unintentional poisoning such as drug overdose, falls and suicide by firearm.
Homicide by means other than firearms also has declined, though not as much as gun homicide; the non-firearm rate declined 41% from 1993 to 2010, according to CDC data.
Another way of examining firearm violence is to look at data from the CDC for firearm injuries, which comes from a survey of hospital emergency rooms. In 2011, nearly 74,000 injuries from firearms were reported in the CDC database, according to a Pew Research Center analysis. Of those, about 56,000 (75%) resulted from assaults.9 Since 2000, the share of firearm injuries that are the result of assaults has ranged from 63% to 75%.
Deaths from mass shootings are a relatively small share of firearm homicides. According to a recent Congressional Research Service report (Congressional Research Service, 2013), 78 public mass shootings occurred in the United States from 1983 through 2012, claiming 547 lives and injuring 476 people. (The count does not include the shooters.)
The Congressional Research Service report did not assess whether mass shootings are more or less frequent than they used to be, but noted that they are relatively uncommon. It stated: “Mass shootings are rare, high-profile events, rather than broad trends that require systematic data collection to understand.”
Noting that definitions differ, the report defined “public mass shootings” as those happening in relatively public places, killing at least four people (not including the shooter) and having a “somewhat indiscriminate” choice of victims. The violence in these cases counted by CRS was “not a means to an end such as robbery or terrorism.”
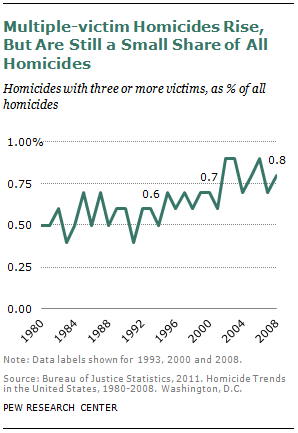
A Bureau of Justice Statistics review of homicide trends from 1980 to 2008 (Cooper and Smith, 2011) found that homicides with multiple victims (in this case, three or more) have increased somewhat as a share of incidents, but are a small share of the total.10 Less than 1% of homicides each year claim three or more victims. These homicides, most of which are shootings, increased as a share of all homicides from 0.5% in 1980 to 0.8% in 2008, according to the bureau’s data.
Homicides with more than one victim were more likely to involve firearms than single-victim homicides, the review concluded. In 2008, 77% of homicides with two or more victims involved guns, according to the Bureau of Justice Statistics review, compared with 66% of single-victim homicides.
Gender and Age Groups
Men (and boys) make up the vast majority (84% in 2010) of gun homicide victims.
The gun homicide rates for both genders have declined by similar amounts since the mid-1990s, though the male rate is much higher—6.2 gun homicides per 100,000 people in 2010, compared with 1.1 for females.
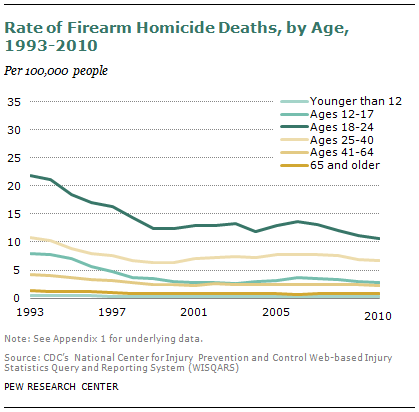
By age group, 69% of gun homicide victims are ages 18 to 40, a proportion that has changed little since 1993. These groups also have the highest homicide rates: In 2010, there were 10.7 gun homicides per 100,000 people ages 18 to 24, compared with 6.7 among those ages 25 to 40, the next highest rate. The lowest rates are for children younger than 12 and for adults ages 65 and older.
Rates of gun homicide fell in all age groups from 1993 to 2000, most dramatically for teenagers, and leveled off or fluctuated since then. From 1993 to 2010, the gun homicide rate declined 65% for those ages 12 to 17, the largest percentage decrease among age groups. The smallest decrease, 37%, was for people ages 25 to 40.
Younger adults are disproportionately likely to be firearms homicide victims. In 2010, young adults ages 18 to 24 were 30% of gun homicide victims in 2010, a higher likelihood than their 10% share of the population would suggest. Similarly, in 2010, people ages 25 to 40 accounted for 40% of gun homicide victims, though they were 21% of the population that year.
Racial and Ethnic Groups

Looked at by race, blacks are over-represented among gun homicide victims; blacks were 55% of shooting homicide victims in 2010, but 13% of the population. By contrast, whites are underrepresented; whites were 25% of the victims of gun homicide in 2010, but 65% of the population. For Hispanics, the 17% share of gun homicide victims was about equal to their 16% proportion of the total population.
The black homicide death rate has declined 50% since its peak in 1993, and the number of black homicide deaths fell by more than a third (37%) from 1993 to 2010. The white homicide death rate has declined by 42% over that time, and the number of white homicide deaths declined 39%. The Hispanic shooting homicide rate fell 69% from 1993 to 2000, and the number of deaths declined by 40%. From 2000 to 2010, when the overall gun homicide rate decline slowed, the Hispanic rate fell 32%, while the black and white rates declined only 4%.
The share of victims by racial or ethnic group has changed little since 1993, but the makeup of the U.S. population has altered. For example, in 1993, Hispanics were 10% of the population, blacks 12% and whites 73%. From 1993 to 2010, the Hispanic population share rose 66%, but the Hispanic share of gun homicide victims has not increased.
The larger decline in gun homicides among blacks and Hispanics, compared with whites, has had a disproportionate effect in driving down the overall gun homicide rate. If the black and Hispanic homicide rates had declined at the same rate as that of whites, the U.S. gun homicide rate would have declined by 35%, instead of 49%, from 1993 to 2010, according to a Pew Research Center analysis.
Suicide by Firearm
Based on death certificates, 19,392 people killed themselves with firearms in 2010, according to data from the Centers for Disease Control and Prevention. That is the highest annual total since the CDC began publishing data in 1981, when the suicide toll was 16,139. Firearm suicide was the fourth leading cause of violent-injury death in 2010, following motor vehicle accidents, unintentional poison (including drug overdose) and falls. Firearms accounted for 51% of suicides in 2010.
The firearm suicide rate peaked in 1990, at 7.6 per 100,000 people, before declining or leveling off for most years since then. However, in recent years, the rate has risen somewhat: From 2007 to 2010, it went up 9%. The firearm suicide rate in 2010 (6.3 per 100,000 people) was the same as it was in 1998. Preliminary 2011 data show 19,766 deaths, and no change in rates from 2010.
The number of firearm suicides has been greater than the number of firearm homicides since at least 1981. But as firearm homicides have declined sharply, suicides have become a greater share of firearm deaths. In 2010, 61% of gun deaths were due to suicide, compared with about half in the mid-1990s. (The remaining firearm deaths, in addition to suicide and homicide, are accidental, of undetermined intent or the result of what the CDC terms “legal intervention,” generally a police shooting.)
Males are the vast majority of gun suicides (87% in 2010), and the suicide rate for males (11.2 deaths per 100,000 people) is more than seven times the female rate (1.5 deaths). The highest firearm suicide rate by age is among those ages 65 and older (10.6 per 100,000 people). The rate for older adults has been relatively steady in recent years; the rate is rising, though, among those ages 41-64, according to CDC data. Among the three largest racial and ethnic groups, whites have the highest suicide rate at 8.5 per 100,000, followed by blacks (2.7) and Hispanics (1.9).
Comparing homicide and suicide rates, suicide rates are higher than homicide rates for men; they are about equal for women. By age group, suicide rates are higher than homicide rates only for adults ages 41-64 and those ages 65 and older. Homicide rates are higher than suicide rates for blacks and Hispanics; for whites, the suicide rate is higher than the homicide rate. Detailed tables on gun suicide can be found in Appendix 1.


