Over the past two decades, the rate of non-fatal violent firearm crime victimizations among Americans ages 12 and older was highest in the early 1990s, and fell sharply (63%) from 1993 through 2000, according to analyses of data from the National Crime Victimization Survey. From 2000 to 2011, the rate declined 33%.
In 2009, 2010 and 2011, the rate of non-fatal firearm crime appeared to rise, compared with the prior year, but the changes are not statistically significant. In 2011, the non-fatal firearm crime rate was 75% lower than it had been in 1993.
For non-fatal gun crimes overall, there were 725.3 victimizations per 100,000 people ages 12 and older in 1993; in 2011, it fell to 181.5 victimizations per 100,000 people.
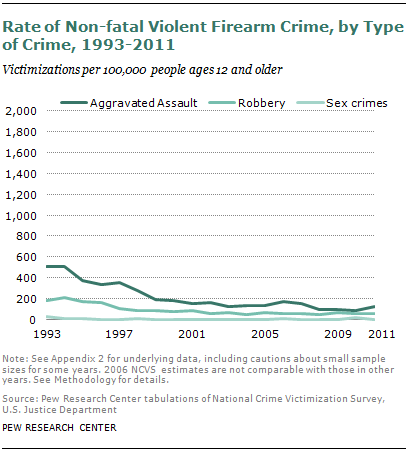
Non-fatal firearm crimes are defined throughout this section as aggravated assault, robbery and sex crimes in which the victim saw a weapon. Aggravated assault and robbery are the main components of non-fatal firearm crime; there are too few sex crimes reported to analyze annual trends reliably.
Over the 1993-2011 period, the victimization rate for aggravated assault with firearms declined 75% and the rate for robbery with firearms declined 70%.
The rate for both gun crimes displayed the same general pattern of large declines in the 1990s. From 2000 to 2011, rates for aggravated assault declined overall. There was no clear trend for robbery with a firearm from 2000 to 2011.
Gender
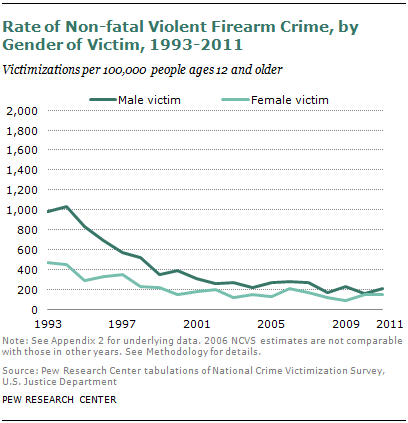
As with firearm homicide, males account for most victimizations by non-fatal violent firearm crime.11 However, men and boys are not as large a share of non-fatal firearm crime victims as they were two decades ago.
Violent victimization rates involving firearms declined for both males and females from 1993 to 2011, with fluctuations in some years.
The male victimization rate declined somewhat more than the female rate—by 79% compared with 68%—from 1993 to 2011. As a result, the share of non-fatal firearm crime victimizations involving men and boys, 66% in 1993, declined to 56% in 2011. The 2011 share of victimizations is higher than the 49% male share of the U.S. population ages 12 and older.
Girls and women made up 51% of the U.S. population ages 12 and older in 2011 but were 44% of the victims of non-fatal violent firearm crime in that age group.
Age Groups
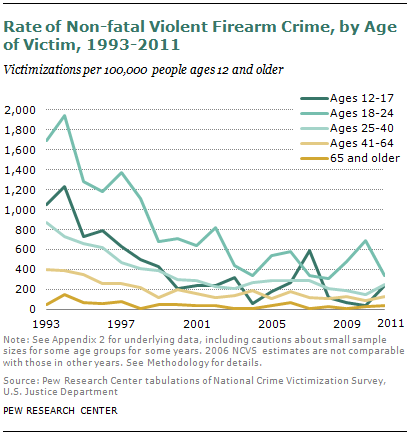
As with gun homicides, young adults are at higher risk than older adults of being the victim of a non-fatal gun crime.
Two decades ago, young adults ages 18 to 24 were more likely than any other age group (among the population ages 12 and older in the victimization survey) to be a victim of non-fatal firearm crime. But the victimization rate of 18- to 24-year-olds declined 80% from 1993 to 2011, compared with the 75% overall decline in non-fatal firearm victimization during those years. By 2011, the rate for this age group was only higher than rates for adults ages 41 and older, but not statistically different from the rate for 12- to 17-year-olds or 25- to 40-year-olds.
In both 1993 and 2011, adults ages 65 and older were less likely than other age groups to be the victim of non-fatal firearm crimes.12 Adults ages 41 to 64 had lower victimization rates for non-fatal firearm crime in 1993 than younger age groups; in 2011, this group had lower rates than adults ages 18 to 24 and 25 to 40, but not than those ages 12 to 17.
Racial and Ethnic Groups
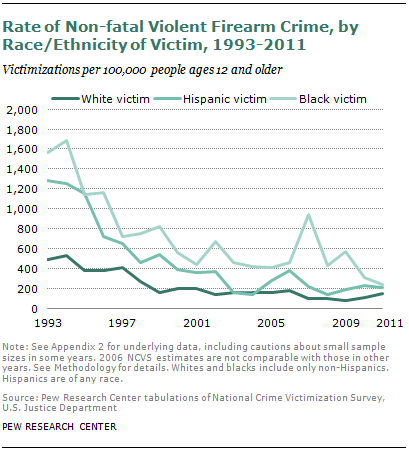
In 2011, the white rate of non-fatal gun crime victimization appears to be somewhat lower than those of Hispanics and blacks, although the differences are not statistically significant. (Those rates were 158.7 victimizations per 100,000 people ages 12 and older for whites, 215.0 for Hispanics and 245.5 for blacks.)
That is different from the pattern for gun homicide, and represents a change from 1993, when the white victimization rate (499.1 per 100,000 people ages 12 and older) was lower than those for Hispanics (1,286.8) and blacks (1,570.0) ages 12 and older.
The non-fatal firearm crime victimization rates of Hispanic and black Americans ages 12 and older fell somewhat more sharply than the white rate from 1993 to 2011: by 83% for Hispanics and 84% for blacks, compared with 68% for whites. The Hispanic population ages 12 and older has more than doubled in size since then, so its rate is a larger factor than in the past in driving the overall rate. (The black population grew 24% in that time, and the white population grew 7%).
All three groups showed a similar pattern of sharper declines from 1993 to 2000 than over the period from 2000 to 2011, for those ages 12 and older. However, in the period from 2008 to 2011, the non-fatal gun crime rate rose for whites (54%). After a single-year spike in 2007, the rate declined for blacks from 2008 to 2011 (44%).


