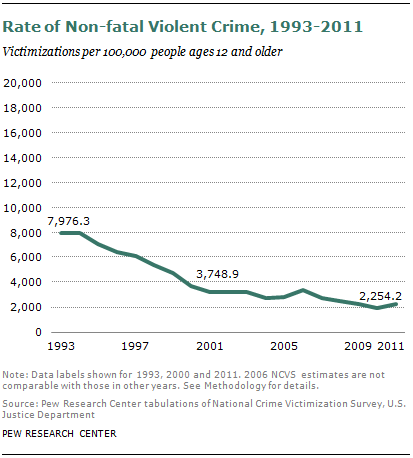
 As with firearm crimes, the rate of overall non-fatal violent crime—defined as aggravated or simple assault, robbery or sex crimes (with or without a gun)—also is lower than it was in the early 1990s. From 1993 to 2011, the U.S. non-fatal violent crime victimization rate for Americans ages 12 and older declined 72%.
There were 2,254 non-fatal violent crime victimizations per 100,000 Americans ages 12 and older in 2011, compared with 7,976 in 1993. The number of such victimizations in 2011—5.8 million—also was a decline from 16.8 million victimizations in 1993.
The non-fatal violent crime victimization rate declined 53% from 1993 to 2000 and decreased an additional 49% from 2000 to 2010. In 2011, the rate grew by 17%.
Looking at the main components of non-fatal violent crime, in 2011, 31% of aggravated assault victimizations involved a gun, the same share as in 1993. In 2011, 26% of robbery victimizations involved a gun, similar to the 22% share in 1993.
By gender, males accounted for 55% of non-fatal violent crime victimizations in 2011, somewhat higher than their 49% proportion of the population ages 12 and older.
Age Groups
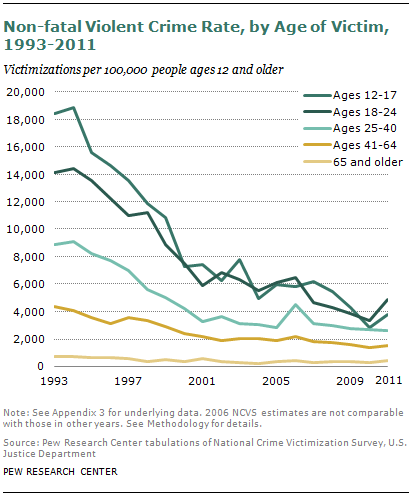 In terms of age, young adults have the highest victimization rates. The highest rate is among those ages 18 to 24, followed by those ages 12 to 17.
Those ages 12 to 24 are a higher share of victims (41% in 2011) than of the population ages 12 and older (21%). Adults ages 41 and older are a lower share of victims (29%) than their share of the population ages 12 and older (53%). Those ages 25 to 40 are a slightly larger share of victims (30%) than of the population ages 12 and older (26%).
Teens ages 12 to 17, for example, are 9% of the population ages 12 and older but were 16% of the victims of non-fatal violent crime in 2011. Adults ages 65 and older are 15% of the population ages 12 and older but were 3% of the victims of non-fatal violent crime in 2011.
Racial and Ethnic Groups
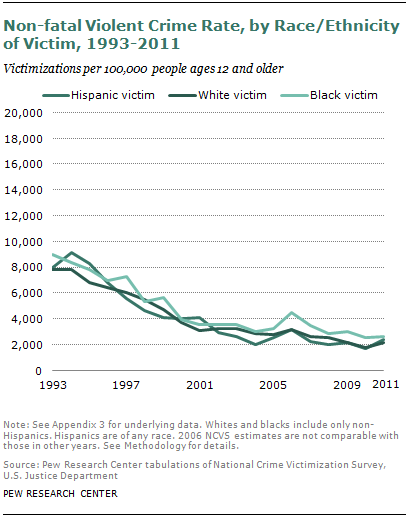 There were no statistically significant differences by racial and ethnic group in 2011 rates of non-fatal violent crime.
Non-fatal violent crime rates declined at a similar pace from 1993 to 2010 among those ages 12 and older in the nation’s three largest racial and ethnic groups—77% for whites, 79% for Hispanics and 71% for blacks.
From 2010 to 2011, the non-fatal violent crime rate for Hispanics went up 42%; the rate for whites rose 18%; and the rate for blacks was essentially stable (up 2%).


