Note
Some trends shown in this report have been updated. Rates for overall gun deaths, firearm homicides and firearm suicides have been updated through 2013. The rate for non-fatal violent firearms victimizations has been updated through 2014. Updated charts and information can be found here.
Chapter 1: Overview
National rates of gun homicide and other violent gun crimes are strikingly lower now than during their peak in the mid-1990s, paralleling a general decline in violent crime, according to a Pew Research Center analysis of government data. Beneath the long-term trend, though, are big differences by decade: Violence plunged through the 1990s, but has declined less dramatically since 2000.
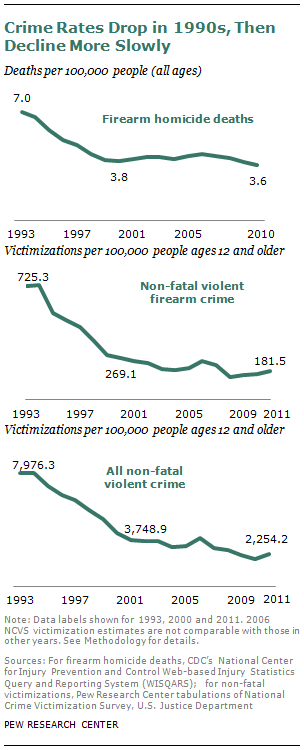
Compared with 1993, the peak of U.S. gun homicides, the firearm homicide rate was 49% lower in 2010, and there were fewer deaths, even though the nation’s population grew. The victimization rate for other violent crimes with a firearm—assaults, robberies and sex crimes—was 75% lower in 2011 than in 1993. Violent non-fatal crime victimization overall (with or without a firearm) also is down markedly (72%) over two decades.
Nearly all the decline in the firearm homicide rate took place in the 1990s; the downward trend stopped in 2001 and resumed slowly in 2007. The victimization rate for other gun crimes plunged in the 1990s, then declined more slowly from 2000 to 2008. The rate appears to be higher in 2011 compared with 2008, but the increase is not statistically significant. Violent non-fatal crime victimization overall also dropped in the 1990s before declining more slowly from 2000 to 2010, then ticked up in 2011.
Despite national attention to the issue of firearm violence, most Americans are unaware that gun crime is lower today than it was two decades ago. According to a new Pew Research Center survey, today 56% of Americans believe gun crime is higher than 20 years ago and only 12% think it is lower.
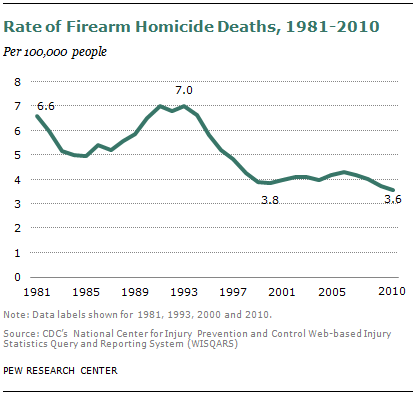
Looking back 50 years, the U.S. gun homicide rate began rising in the 1960s, surged in the 1970s, and hit peaks in 1980 and the early 1990s. (The number of homicides peaked in the early 1990s.) The plunge in homicides after that meant that firearm homicide rates in the late 2000s were equal to those not seen since the early 1960s.1 The sharp decline in the U.S. gun homicide rate, combined with a slower decrease in the gun suicide rate, means that gun suicides now account for six-in-ten firearms deaths, the highest share since at least 1981.
Trends for robberies followed a similar long-term trajectory as homicides (National Research Council, 2004), hitting a peak in the early 1990s before declining.
This report examines trends in firearm homicide, non-fatal violent gun crime victimization and non-fatal violent crime victimization overall since 1993. Its findings on firearm crime are based mainly on analysis of data from two federal agencies. Data from the Centers for Disease Control and Prevention, using information from death certificates, are the source of rates, counts and trends for all firearm deaths, homicide and suicide, unless otherwise specified. The Department of Justice’s National Crime Victimization Survey, a household survey conducted by the Census Bureau, supplies annual estimates of non-fatal crime victimization, including those where firearms are used, regardless of whether the crimes were reported to police. Where relevant, this report also quotes from the FBI’s Uniform Crime Reports (see text box at the end of this chapter and the Methodology appendix for more discussion about data sources).
Researchers have studied the decline in firearm crime and violent crime for many years, and though there are theories to explain the decline, there is no consensus among those who study the issue as to why it happened.
There also is debate about the extent of gun ownership in the U.S., although no disagreement that the U.S. has more civilian firearms, both total and per capita, than other nations. Compared with other developed nations, the U.S. has a higher homicide rate and higher rates of gun ownership, but not higher rates for all other crimes. (See Chapter 5 for more details.)
In the months since the mass shooting at a Newtown, Conn., elementary school in December, the public is paying close attention to the topic of firearms; according to a recent Pew Research Center survey (Pew Research Center, April 2013) no story received more public attention from mid-March to early April than the debate over gun control. Reducing crime has moved up as a priority for the public in polling this year.
Mass shootings are a matter of great public interest and concern. They also are a relatively small share of shootings overall. According to a Bureau of Justice Statistics review, homicides that claimed at least three lives accounted for less than 1% of all homicide deaths from 1980 to 2008. These homicides, most of which are shootings, increased as a share of all homicides from 0.5% in 1980 to 0.8% in 2008, according to the bureau’s data. A Congressional Research Service report, using a definition of four deaths or more, counted 547 deaths from mass shootings in the U.S. from 1983 to 2012.2
Looking at the larger topic of firearm deaths, there were 31,672 deaths from guns in the U.S. in 2010. Most (19,392) were suicides; the gun suicide rate has been higher than the gun homicide rate since at least 1981, and the gap is wider than it was in 1981.
Knowledge About Crime
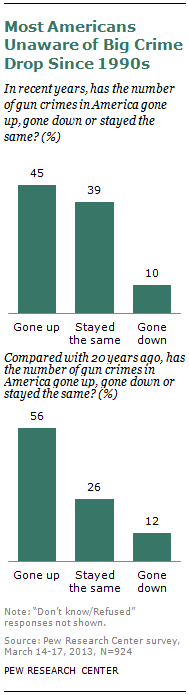
Despite the attention to gun violence in recent months, most Americans are unaware that gun crime is markedly lower than it was two decades ago. A new Pew Research Center survey (March 14-17) found that 56% of Americans believe the number of crimes involving a gun is higher than it was 20 years ago; only 12% say it is lower and 26% say it stayed the same. (An additional 6% did not know or did not answer.)
Men (46%) are less likely than women (65%) to say long-term gun crime is up. Young adults, ages 18 to 29, are markedly less likely than other adults to say long-term crime is up—44% do, compared with more than half of other adults. Minority adults are more likely than non-Hispanic whites to say that long-term gun crime is up, 62% compared with 53%.
Asked about trends in the number of gun crimes “in recent years,” a plurality of 45% believe the number has gone up, 39% say it is about the same and 10% say it has gone down. (An additional 5% did not know or did not answer.) As with long-term crime, women (57%) are more likely than men (32%) to say that gun crime has increased in recent years. So are non-white adults (54%) compared with whites (41%). Adults ages 50 and older (51%) are more likely than those ages 18-49 (42%) to believe gun crime is up.
What is Behind the Crime Decline?
Researchers continue to debate the key factors behind changing crime rates, which is part of a larger discussion about the predictors of crime.3 There is consensus that demographics played some role: The outsized post-World War II baby boom, which produced a large number of people in the high-crime ages of 15 to 20 in the 1960s and 1970s, helped drive crime up in those years.
A review by the National Academy of Sciences of factors driving recent crime trends (Blumstein and Rosenfeld, 2008) cited a decline in rates in the early 1980s as the young boomers got older, then a flare-up by mid-decade in conjunction with a rising street market for crack cocaine, especially in big cities. It noted recruitment of a younger cohort of drug seller with greater willingness to use guns. By the early 1990s, crack markets withered in part because of lessened demand, and the vibrant national economy made it easier for even low-skilled young people to find jobs rather than get involved in crime.
At the same time, a rising number of people ages 30 and older were incarcerated, due in part to stricter laws, which helped restrain violence among this age group. It is less clear, researchers say, that innovative policing strategies and police crackdowns on use of guns by younger adults played a significant role in reducing crime.
Some researchers have proposed additional explanations as to why crime levels plunged so suddenly, including increased access to abortion and lessened exposure to lead. According to one hypothesis, legalization of abortion after the 1973 Supreme Court Roe v. Wade decision resulted in fewer unwanted births, and unwanted children have an increased risk of growing up to become criminals. Another theory links reduced crime to 1970s-era reductions in lead in gasoline; children’s exposure to lead causes brain damage that could be associated with violent behavior. The National Academy of Sciences review said it was unlikely that either played a major role, but researchers continue to explore both factors.
The plateau in national violent crime rates has raised interest in the topic of how local differences might influence crime levels and trends. Crime reductions took place across the country in the 1990s, but since 2000, patterns have varied more by metropolitan area or city.4
One focus of interest is that gun ownership varies widely by region and locality. The National Academy of Sciences review of possible influences on crime trends said there is good evidence of a link between firearm ownership and firearm homicide at the local level; “the causal direction of this relationship remains in dispute, however, with some researchers maintaining that firearm violence elevates rates of gun ownership, but not the reverse.”
There is substantial variation within and across regions and localities in a number of other realms, which complicates any attempt to find a single cause for national trends. Among the variations of interest to researchers are policing techniques, punishment policies, culture, economics and residential segregation.
Internationally, a decline in crime, especially property crime, has been documented in many countries since the mid-1990s. According to the authors of a 30-country study on criminal victimization (Van Dijk et al., 2007), there is no general agreement on all the reasons for this decline. They say there is a general consensus that demographic change—specifically, the shrinking proportion of adolescents across Europe—is a common factor causing decreases across Western countries. They also cite wider use of security measures in homes and businesses as a factor in reducing property crime.
But other potential explanations—such as better policing or increased imprisonment—do not apply in Europe, where policies vary widely, the report noted
Among the major findings of this Pew Research Center report:
U.S. Firearm Deaths
- In 2010, there were 3.6 gun homicides per 100,000 people, compared with 7.0 in 1993, according to CDC data.
- In 2010, CDC data counted 11,078 gun homicide deaths, compared with 18,253 in 1993.5
- Men and boys make up the vast majority (84% in 2010) of gun homicide victims. The firearm homicide rate also is more than five times as high for males of all ages (6.2 deaths per 100,000 people) as it is for females (1.1 deaths per 100,000 people).
- By age group, 69% of gun homicide victims in 2010 were ages 18 to 40, an age range that was 31% of the population that year. Gun homicide rates also are highest for adults ages 18 to 24 and 25 to 40.
- A disproportionate share of gun homicide victims are black (55% in 2010, compared with the 13% black share of the population). Whites were 25% of victims but 65% of the population in 2010. Hispanics were 17% of victims and 16% of the population in 2010.
- The firearm suicide rate (6.3 per 100,000 people) is higher than the firearm homicide rate and has come down less sharply. The number of gun suicide deaths (19,392 in 2010) outnumbered gun homicides, as has been true since at least 1981.
U.S. Firearm Crime Victimization
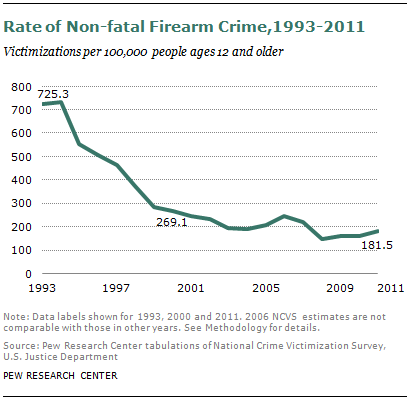
- In 2011, the NCVS estimated there were 181.5 gun crime victimizations for non-fatal violent crime (aggravated assault, robbery and sex crimes) per 100,000 Americans ages 12 and older, compared with 725.3 in 1993.
- In terms of numbers, the NCVS estimated there were about 1.5 million non-fatal gun crime victimizations in 1993 among U.S. residents ages 12 and older, compared with 467,000 in 2011.
U.S. Other Non-fatal Crime
- The victimization rate for all non-fatal violent crime among those ages 12 and older—simple and aggravated assaults, robberies and sex crimes, with or without firearms—dropped 53% from 1993 to 2000, and 49% from 2000 to 2010. It rose 17% from 2010 to 2011.
- Although not the topic of this report, the rate of property crimes—burglary, motor vehicle theft and theft—also declined from 1993 to 2011, by 61%. The rate for these types of crimes was 351.8 per 100,000 people ages 12 and older in 1993, 190.4 in 2000 and 138.7 in 2011.
Context
- The number of firearms available for sale to or possessed by U.S. civilians (about 310 million in 2009, according to the Congressional Research Service) has grown in recent years, and the 2009 per capita rate of one person per gun had roughly doubled since 1968. It is not clear, though, how many U.S. households own guns or whether that share has changed over time.
- Crime stories accounted for 17% of the total time devoted to news on local television broadcasts in 2012, compared with 29% in 2005, according to Pew Research Center’s Project for Excellence in Journalism. Crime trails only traffic and weather as the most common type of story on these newscasts.
About the Data
Findings in this report are based on two main data sources:
Data on homicides and other deaths are from the Centers for Disease Control and Prevention, based on information from death certificates filed in state vital statistics offices, which includes causes of death reported by attending physicians, medical examiners and coroners. Data also include demographic information about decedents reported by funeral directors, who obtain that information from family members and other informants. Population data, used in constructing rates, come from the Census Bureau. Most statistics were obtained via the National Center for Injury Prevention and Control’s Web-based Injury Statistics Query and Reporting System (WISQARS), available from URL: www.cdc.gov/ncipc/wisqars. Data are available beginning in 1981; suitable population data do not exist for prior years. For more details, see Appendix 4.
Estimates of crime victimization are from the National Crime Victimization Survey, a sample survey conducted for the Bureau of Justice Statistics by the Census Bureau. Although the survey began in 1973, this report uses data since 1993, the first year employing an intensive methodological redesign. The survey collects information about crimes against people and households, but not businesses. It provides estimates of victimization for the population ages 12 and older living in households and non-institutional group quarters; therefore it does not include populations such as homeless people, visiting foreign tourists and business travelers, or those living in institutions such as military barracks or mental hospitals. The survey collects information about the crimes of rape, sexual assault, personal robbery, aggravated and simple assault, household burglary, theft, and motor vehicle theft. For more details, see Appendix 4.
Roadmap to the Report
The remainder of this report is organized as follows. Chapter 2 explores trends in firearm homicide and all firearm deaths, as well as patterns by gender, race and age. Chapter 3 analyzes trends in non-fatal violent gun crime victimizations, as well as patterns by gender, race and age. Chapter 4 looks at trends and subgroup patterns for non-fatal violent crime victimizations overall. Chapter 5 examines issues related to the topic of firearms: crime news, crime as a public priority, U.S. gun ownership data, and comparison of ownership and crime rates with those in other nations. Appendices 1-3 consist of detailed tables with annual data for firearm deaths, homicides and suicides, as well as non-fatal firearm and overall non-fatal violent crime victimization, for all groups and by subgroup. Appendix 4 explains the report’s methodology.
Notes on Terminology
All references to whites, blacks and others are to the non-Hispanic components of those populations. Hispanics can be of any race.
“Aggravated assault,” as defined by the Bureau of Justice Statistics, is an attack or attempted attack with a weapon, regardless of whether an injury occurred, and an attack without a weapon when serious injury results.
The terms “firearm” and “gun” are used interchangeably.
“Homicides,” which come from Centers for Disease Control and Prevention data, are fatal injuries inflicted by another person with intent to injure or kill. Deaths due to legal intervention or operations of war are excluded. Justifiable homicide is not identified.
“Robbery,” as defined by the Bureau of Justice Statistics, is a completed or attempted theft, directly from a person, of property or cash by force or threat of force, with or without a weapon, and with or without injury.
“Sex crime,” as defined by the Bureau of Justice Statistics, includes attempted rape, rape and sexual assault.
“Simple assault,” as defined by the Bureau of Justice Statistics, is an attack (or attempted assault) without a weapon resulting either in no injury, minor injury (for example, bruises, black eyes, cuts, scratches or swelling) or in undetermined injury requiring less than two days of hospitalization.
“Victimization” is based on self-reporting in the National Crime Victimization Survey, which includes Americans ages 12 and older. For personal crimes (which in this report include assault, robbery and sex crime), it is expressed as a rate based on the number of victimizations per 100,000 U.S. residents ages 12 and older. See the Methodology appendix for more details.
Acknowledgments
Many researchers and scholars contributed to this report. Senior writer D’Vera Cohn wrote the body of the report. Paul Taylor, senior vice president of the Pew Research Center, provided editorial guidance. Mark Hugo Lopez, senior researcher and associate director of the Pew Hispanic Center, managed the report’s data analysis and wrote the report’s methodology appendix. Catherine A. Gallagher, director of the Cochrane Collaboration of the College for Policy at George Mason University, provided guidance on the report’s data analysis and comments on earlier drafts of the report. Lopez and Kim Parker, associate director of the Center’s Social & Demographic Trends project, managed the report’s development and production. Kevin T. Maass, research associate at the Cochrane Collaboration at George Mason University’s College for Policy, provided analysis of the FBI’s Uniform Crime Reports. Research Assistants Eileen Patten and Anna Brown number-checked the report and prepared charts and tables. Patten also conducted background research on trends in crime internationally. The report was copy-edited by Marcia Kramer of Kramer Editing Services.
The report also benefited from a review by Professor Richard Felson of Pennsylvania State University. The authors also thank Andrew Kohut and Scott Keeter for their comments on an earlier draft of the report. In addition, the authors thank Kohut, Michael Dimock, Keeter and Alec Tyson, our colleagues at the Pew Research Center, for guidance on the crime knowledge public opinion survey questionnaire. Jeffrey Passel, senior demographer at the Pew Research Center, provided computational assistance for the report’s analysis of homicide rates by race and ethnicity.
Finally, Michael Planty and Jennifer Truman of the Bureau of Justice Statistics at the U.S. Department of Justice provided data, invaluable guidance and advice on the report’s analysis of the National Crime Victimization Survey.


