The lesbian, gay, bisexual and transgender population is one of the most Democratic demographic groups in the country. According to the 2012 national exit polls conducted by the National Election Pool, gay, lesbian, and bisexual adults voted for Barack Obama over Mitt Romney by more than three-to-one (76% vs. 22%).
This Democratic advantage can be seen in the partisan identification of LGBT adults, a majority of whom are Democrats. It also expresses itself in policy preferences across a range of issues, including size of government, attitudes about gun policy and immigration.
When it comes to issues of specific interest to the LGBT population, many LGBT adults say equal rights, including employment rights, marriage rights and adoption rights, should be top policy priorities. Many also say the same about prevention and treatment of HIV/AIDS.
A Democratic Constituency
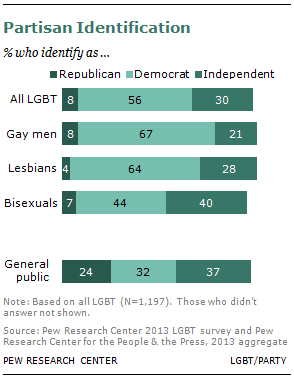
More than half (56%) of LGBT adults consider themselves to be Democrats, just 8% identify as Republican and 30% are independent. By comparison, 32% of the general public are Democrats, 24% are Republicans, and 37% are independents.
The overwhelming Democratic identification of LGBT adults is even clearer when leaned partisanship of independents is taken into account. About eight-in-ten (79%) LGBT adults are Democrats or lean Democratic, while just 18% are Republican or lean Republican.
Democratic affiliation is higher among gay men (67%) and lesbians (64%) than among bisexuals (44%). Still, about three-quarters of bisexuals (74%) identify as Democrats or lean toward the Democratic Party.
Half of LGBT adults (50%) self-identify as liberal, 37% are moderate, and just 12% say they are conservative. LGBT adults are about three times as likely as the overall public to be liberal Democrats (36% vs. 11% of the overall public). In addition, 49% plurality of gay men are liberal Democrats, significantly more than among lesbians (36%) and bisexuals (28%).
Views of Barack Obama
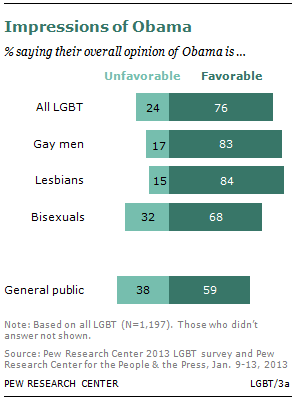
Barack Obama is viewed favorably by 76% of LGBT adults. A Pew Research Center survey in January, found that 59% of the general public viewed Obama favorably.
The higher favorable rating for Obama among LGBT adults is reflective of their strong Democratic leanings: 89% of Democratic and Democratic-leaning LGBT adults have a favorable impression of Obama, compared with 79% of all Democrats and Democratic leaners. Among Republican and Republican-leaning LGBT adults, just 23% view Obama favorably, while 77% view him unfavorably. (Among all Republicans and Republican leaners, Obama’s rating was 22% favorable, 75% unfavorable in January.)
While Obama enjoys positive ratings across the LGBT population, gay men (83%) and lesbians (84%) are more likely than bisexuals (68%) to say they have a favorable impression.
Ratings of the Major Parties
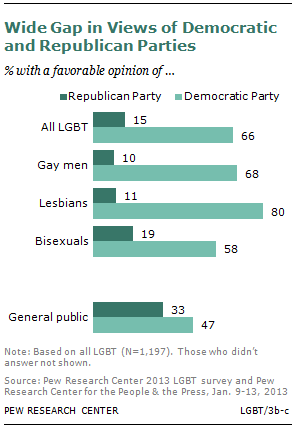
The two major parties are viewed very differently among LGBT adults: About two-thirds (66%) have a favorable opinion of the Democratic Party, while just 15% have a favorable impression of the Republican Party. Among the general public, the Democratic Party is also rated higher than the GOP, but the gap is much narrower (14 points).
Of all LGBT adults, lesbians hold the most positive views of the Democratic Party, with eight-in-ten (80%) having a favorable opinion. About two-thirds of gay men (68%) also have a positive opinion of the Democrats, as do a smaller majority (58%) of bisexuals.
Supreme Court Views
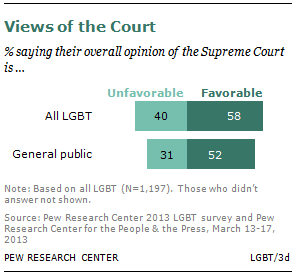
Just weeks before the Supreme Court is set to rule on two cases involving same-sex marriage, 58% of LGBT adults have a favorable view of the institution while 40% view it unfavorably, with similar views of the court among gay men, lesbians and bisexuals. These ratings are similar to the public’s views of the court.
Majority of LGBT Adults Say Country Is on the Right Track
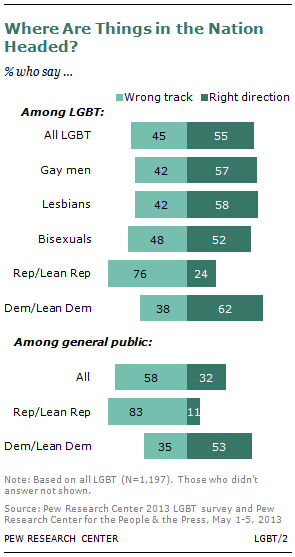
A 55% majority of LGBT adults say that things in the nation are generally headed in the right direction, while 45% say they are off on the wrong track. This is a much more optimistic view of the nation’s direction than among the overall public: Just 32% of the public says the nation is headed in the right direction, while 58% say it is off on the wrong track.
Views about the direction of the country are strongly correlated with party, as evidenced by large partisan divides on this question both within the LGBT population and the overall public. About six-in-ten LGBT Democrats and Democratic leaners (62%) have a positive view about the direction of the country; that compares with 24% of LGBT Republicans and Republican leaners.
Yet even within partisan groups, LGBT adults are more upbeat about the direction of the nation than the general public is. A narrow majority of all Democrats and Democratic leaners (53%) say the country is headed in the right direction, compared with 62% of LGBT Democrats. Similarly, although 11% of all Republicans and Republican leaners say things are going in the right direction, 24% of LGBT Republicans and leaners express this view.
What Are the Priorities When It Comes to LGBT-Related Policy Issues?
Asked in an open-ended question to name the most important problems facing the lesbian, gay, bisexual, and transgender population today, 57% of LGBT adults volunteer some aspect of social treatment. The aspects raised include: 28% mentioning discrimination, prejudice, or lack of equality; 19% citing a general lack of acceptance; 13% saying ignorance; and 7% mentioning violence or bullying.
An additional 32% cite legal rights, including 15% who specifically mention the right to legally marry. The other or more general mentions of legal rights include some rights traditionally associated with marriage (such as hospital visitation rights or shared health insurance or tax benefits) as well as some statements about wanting the same rights as married heterosexual couples, even if those rights aren’t granted through marriage.
Although garnering fewer mentions, other problems mentioned include religious opposition (8%), self-acceptance (3%), and sexually transmitted diseases, including HIV/AIDS (2%).39
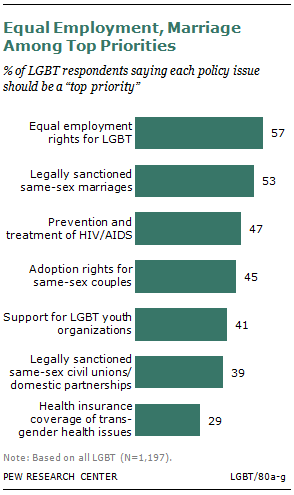
LGBT respondents were also asked to rate several specific policies that affect the LGBT population as a top priority, very important but not a top priority, a somewhat important priority or not a priority at all. Fully 57% of LGBT adults say equal employment rights should be a top priority, while 53% cite legally sanctioned marriages for same-sex couples as a top priority.
About half (47%) of LGBT respondents say more efforts aimed at prevention and treatment of HIV and AIDS should be a top priority. A similar share (45%) says adoption rights for same- sex couples should be a top policy priority. Roughly four-in-ten say support for organizations that provide services to LGBT youth (41%) and legally sanctioned civil unions or domestic partnerships for same-sex couples (39%) should be top policy priorities. Coverage of transgender health issues by health insurance ranks last, with 29% saying it should be a top priority.
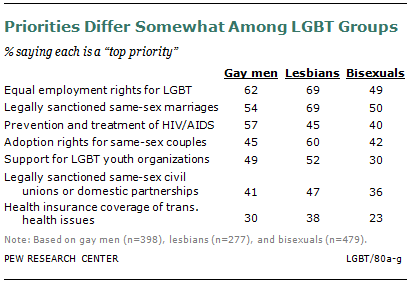
Among the different LGBT groups, lesbians are more likely than gay men and bisexuals to rate legal marriage and adoption rights as top priorities. About seven-in-ten (69%) lesbians say legal marriage should be a top priority, compared with 54% of gay men and 50% of bisexuals. And six-in-ten (60%) lesbians say the same about adoption rights, compared with 45% of gay men and 42% of bisexuals. Meanwhile, gay men are more likely than lesbians and bisexuals to say HIV/AIDS prevention and treatment programs should be a top priority—57% of gay men say this, compared with 45% of lesbians and 40% of bisexuals.
Voices: Most Important Problems Facing the LGBT Population
Social treatment: discrimination, lack of acceptance, ignorance, and violence
“Same as always: ignorance. We are not sexual predators. We want to enlarge, not destroy the institution of marriage. We want to live in happy families.” – Gay man, age 68
“Privately — acceptance of self and putting so much emphasis on others acceptance of us. Publicly — the lies and fighting coming from all sides of the ‘battle.’ ” – Lesbian, age 50
“Oppression by religious people who try to force their views about us on others. LGBT youth are committing suicide because the message in our culture is that they are garbage and have no value. We live in a country that is seeing the hatred for differences on the rise. Where religious and political parties are using fear of differences to fuel hatred and cause their followers to seek out people of differences to beat up and kill.” – Lesbian, age 64
“Hate crimes and violence, and the fear of both of those things – they are absolutely unnecessary and uncivil.” – Bisexual woman, age 22
Legal rights: marriage and more
“People view anything different than themselves…as a threat to them and society. That is why there is such discrimination against them: marriage, adoptions, benefits, etc…” – Transgender person, age 56
“Legal barriers to establishing long term relationships, especially for younger people who want to start families and hold property together.” – Lesbian, age 60
“I think that equal employment opportunity and financial benefits from marriage are among the most important issues facing LGBT individuals in society these days.” – Bisexual woman, age 25
LGBT/52
Policy Preferences
Across a variety of issues, the views of the LGBT population differ from the overall public in ways that are largely consistent with the Democratic political preferences of the LGBT population.
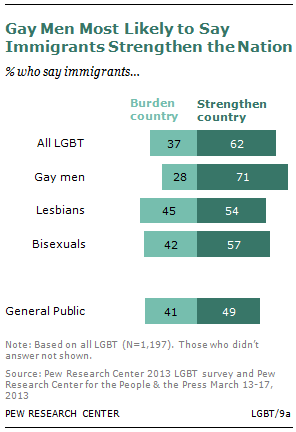
Views of immigrants are more positive among the LGBT population than the population as a whole. About six-in-ten (62%) LGBT adults say immigrants “strengthen our country because of their hard work and talents,” while far fewer (37%) say immigrants are a burden “because they take our jobs, housing and health care.” Among the public, 49% say immigrants strengthen the country while 41% say they are a burden.
The view that immigrants strengthen the country is more prevalent among gay men than among other LGBT adults: 71% of gay men say this, compared with 54% of lesbians and 57% of bisexuals.
When it comes to views of gun control, a clear majority of LGBT adults say controlling gun ownership is more important than protecting the right to own guns (64% vs. 36%), in contrast to the nearly even split on this issue among the general public (50% control ownership, 48% protect rights).
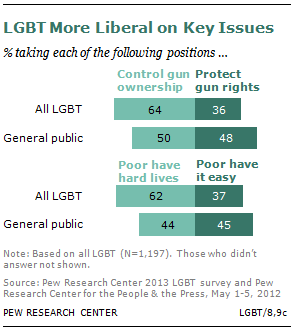
And roughly six-in-ten LGBT adults (62%) say that “poor people have hard lives because government benefits don’t go far enough to help them live decently,” while just 37% say “poor people today have it easy because they can get government benefits without doing anything in return.” By contrast, the general public is divided on this question (44% say the poor have hard lives, and 45% say they have it easy).
Size of Government
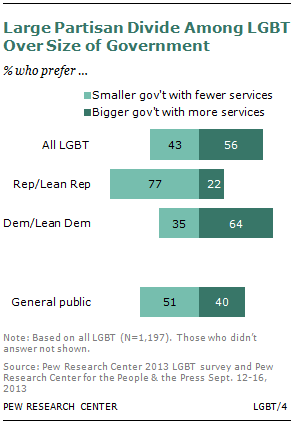
Overall, more LBGT adults say they would rather have a bigger government that provides more services than a smaller government that provides fewer services (56% vs. 43%). Among the general public, a narrow majority would opt for a smaller government (51% vs. 40%).
But partisan differences within the LGBT population are as pronounced as within the overall public. While about two-thirds of LGBT Democrats and Democratic leaners (64%) prefer a bigger government, 77% of LGBT Republicans and Republican leaners would prefer a smaller one.
Political Participation

On measures of political registration and voting, the LGBT population is as politically active as the general public. About three-quarters (77%) say they are certain they are registered to vote, nearly identical to the rate among the public (74%).
And about three-quarters of LGBT adults say they always (49%) or nearly always (26%) vote, little different than the 71% of the public who say they vote always (50%) or nearly always (21%).
Gay men and lesbians are registered to vote at higher rates than bisexuals (83% of gays and lesbians vs. 69% of bisexuals) and are also more likely to say they vote often. Younger bisexuals (those age 44 and younger) are significantly less likely than their gay and lesbian counterparts to be registered or regularly vote, although there is no difference in registration rates between bisexuals and gays and lesbians ages 45 and older.
As is the case among the general public, younger LGBT adults are less likely than older adults to be registered or report voting.
On a measure of attention to government and public affairs, 31% of LGBT adults report following government affairs most of the time, while 51% of the general public says this. This gap between LGBT adults and all adults holds among most age groups. However, a word of caution in interpreting this difference, since it may be attributable to differences in survey administration between the LGBT survey and general populations surveys.40


