In 2011, fully 7 million grandparents were living in the same household as their grandchildren. This marks a 22% increase from 2000, when 5.8 million grandparents lived with their grandchildren, and a 13% increase from 2007. As is the case with co-resident grandchildren, the number of grandparents rose notably during the recession and is beginning to level off.

All told, more than 2.7 million grandparents not only live with a grandchild, but also serve as the primary caregiver to that child. This marks a 12% increase from 2000, and most of that increase occurred since the onset of the recession in 2007. From 2007 to 2008, the number of grandparent caregivers grew by 5%; from 2008 to 2009, the number grew 3%. Since that time, the number of caregiving grandparents has declined slightly.
Most of these grandparents are spending an extended period of time as primary caregivers to their grandchildren. Some 55% have been doing so for three years or more (38% for five years or more), and almost one-fourth (23%) have been responsible for their grandchild for one to two years. One-fifth (21%) have been caring for a grandchild for less than a year.
Profiles of Grandparents who Are Living with or Serving as Primary Caregivers for their Grandchildren
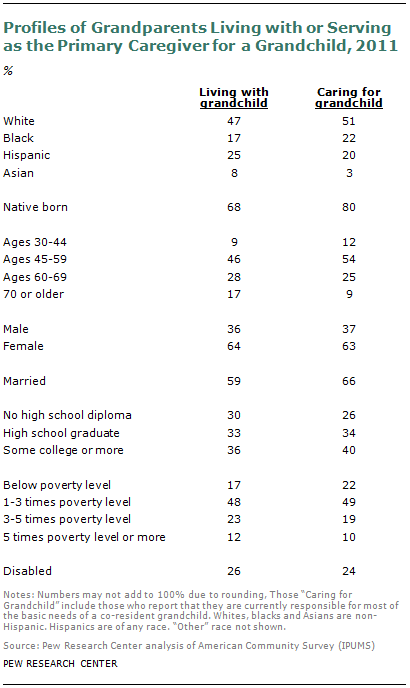
A plurality (47%) of co-residing grandparents are white, and fully one-fourth (25%) are Latino. Some 17% are black, and 8% are Asian. Fully half of grandparent caregivers (51%) are white, while 22% are black, 20% are Latino and 3% are Asian. In the full population of people ages 50 and older, whites comprise a larger share—76%. Ten percent of this group is black, 9% is Hispanic and 4% is Asian.
While the majority—68%—of grandparent co-residers are native born, a disproportionate share—32%—were born in Puerto Rico or another country. And among grandparent caregivers, 80% are native born and the remaining 20% are foreign born. Among all people ages 50 and older, fully 86% are native born.
Grandparent co-residers and caregivers tend to be relatively young. The majority (54%) of co-residers are under the age of 60, and 9% are less than 45 years old. At the other end of the spectrum, 17% are in their 70s, or older. Among grandparent caregivers, 12% are less than 45 years old, and more than half (54%) are ages 45 to 59. One-fourth (25%) are ages 60 to 69 and just 9% are 70 years or older.
Almost two-thirds (64%) of grandparents who are living with their grandchildren are women, and 36% are men. As with co-residers, the majority (63%) of grandparent caregivers are grandmothers, as opposed to grandfathers. In contrast, 46% of the population ages 50 and older is male, and just 54% is female.
About six-in-ten (59%) grandparent co-residers are married, as are two-thirds (66%) of grandparent caregivers. In the general population, six-in-ten people ages 50 and older are married.
Grandparent co-residers and caregivers have relatively low levels of education. Some 30% of grandparent co-residers lack a high school diploma, 33% have a high school diploma, and 36% report that they have attended college. A quarter (26%) of grandparent caregivers lack a high school diploma, 34% have a high school diploma, and four-in-ten (40%) have at least some college experience. In comparison, just 16% of people ages 50 and older lack a high school diploma, and more than half (53%) have attended college.
Among co-residing grandparents, 17% are living below the poverty line, and 48% are living between the poverty level and three times the poverty level. Among caregiving grandparents, one-fifth (22%) are living below the poverty line. About half (49%) are living at or a bit above the poverty line. The remaining 29% are living at least three times above the poverty line. Among the broader population of people ages 50 and older, just 10% have incomes below the poverty line.
About one-fourth of both grandparent co-residers (26%) and grandparent caregivers (24%) report that they are dealing with a significant disability of some kind. These rates are very similar to the rate among the general population ages 50 and older (26%).
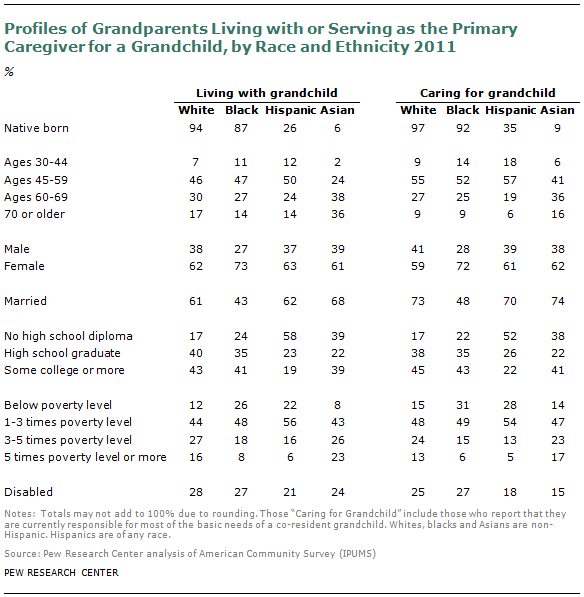
Profiles of Grandparents who Are Living with or Primary Caregivers for their Grandchildren, by Race and Ethnicity
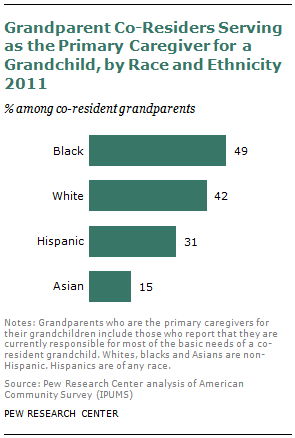
The likelihood that a co-resident grandparent will also be the primary caregiver of a grandchild varies notably by race and ethnicity. About half (49%) of black co-resident grandparents are the primary caregiver for a grandchild. The share is also quite high—42%—among white grandparents. Among Latino co-resident grandparents, the share drops to 31%, and just 15% of Asian co-resident grandparents are the primary caregiver for their grandchild.
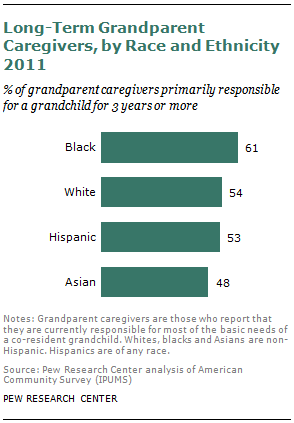
The amount of time that caregiving grandparents have spent as a primary caregiver to a grandchild is high across all racial and ethnic groups, but again there is also notable variation. Fully six-in-ten (61%) black caregiving grandparents report that they have spent three or more years as the primary caregiver of a grandchild. This share drops to 54% for white grandparent caregivers and 53% for those who are Latino. Just less than half (48%) of Asian grandparent caregivers report spending so many years caring for a grandchild.
The vast majority of white grandparents who are living with or caring for a grandchild are native born (94% and 97%, respectively). The same is true for African American grandparents (87% of co-residers are native born, as are 92% of caregivers). Among Latinos and Asians, though, only a minority of grandparent co-residers and caregivers were born in the U.S. Among Latinos, 26% of co-residers were born in the U.S., as were 35% of caregivers. And among Asian grandparents who are living with a grandchild, only 6% were born in the U.S. Some 9% of Asian grandparents who are caring for a grandchild are native born.
The share of young grandparent co-residers is higher among blacks and Hispanics than among other groups, likely reflecting the fact that these groups are more likely to have children at younger ages. While 11% of blacks and 12% of Hispanics who are grandparent co-residers are less than 45 years old, this share is 7% among whites and 2% among Asian grandparent co-residers. Among grandparent caregivers, it is also the case that a disproportionate share of Hispanics (18%) and blacks (14%) are younger than 45 years of age, compared with 9% of whites and 6% of Asians.
The share of women who are co-residers or caregivers is markedly higher for blacks than for the other groups. Fully 73% of black co-residing grandparents are female, while the share among the other racial and ethnic groups ranges from 61% to 63%. And the composition of grandparent caregivers is almost exactly the same—72% of black caregivers are women, while the share that is female is 59% to 62% among the other racial and ethnic groups.
African American co-residers and caregivers are also much less likely to be married than other racial and ethnic groups—this is reflective of the low marriage rates in the African American community in general. Some 43% of black grandparent co-residers are married, compared with 61% of whites, 62% of Hispanics and 68% of Asians. The results are more dramatic among caregivers. While less than half (48%) of blacks are married, 70% of Hispanics are, as are 73% of whites and 74% of Asians.
Latino grandparents who are co-residers or caregivers are significantly more likely than others to lack a high school diploma. At the other end of the educational spectrum, 19% of Hispanic co-residers and 22% of Hispanic caregivers report any college experience. In comparison, across all other groups, the shares of co-residers and caregivers with college experience hover around 40%.
As is the case in the larger population, it is among black and Latino grandparent co-residers and caregivers that poverty is most prevalent. Fully 26% of black co-residers and 22% of Latino co-residers have household incomes below the poverty line, compared with 12% of white grandparent co-residers and 8% of Asian grandparent co-residers. Among caregiving grandparents, 31% of blacks are living below the poverty line, as are 28% of Hispanics. The shares living below the poverty line drop to 15% for whites and 14% for Asians.
White grandparent co-residers are the most likely to report a disability of some kind—28% do—while Hispanic co-residers are the least likely to report as much, with 21% reporting a disability. The racial and ethnic gap is a bit wider among grandparent caregivers. While 27% of blacks report a disability, only 15% of Asian caregivers report as much.