Government Data
Most of the analysis in Chapter 1 is based on the Current Population Survey (CPS). The CPS is collected monthly by the U.S. Census Bureau for the Bureau of Labor Statistics. The survey is the basis for the widely reported monthly national unemployment rate. This report uses the CPS’s Annual Social and Economic Supplement (CPS ASEC), conducted in March of each year. The CPS sample size is expanded for the ASEC collection and in 2013 was based on interviews with about 75,000 households. The CPS is nationally representative of the civilian noninstitutionalized population. The integrated micro data files of the March CPS produced by the University of Minnesota were analyzed. Additional documentation on the March CPS IPUMS can be found at https://cps.ipums.org/cps/.
The unweighted number of 25- to 32-year-olds in each survey year are as follows:
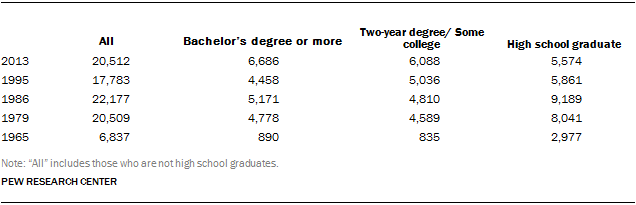
The CPS has been collected since the 1940s, but there have been revisions in the information collected since its initiation. In 1992, the Census Bureau altered the educational attainment question. Prior to 1992, respondents were asked about the number of grades of school completed rather than their highest educational degree attained. So for surveys before 1992 (1986, 1979 and 1965) a “high school graduate” refers to those who completed 12th grade (regardless of whether they received a high school diploma); “some college” refers to those who reported completing one to three years of college, and respondents who completed at least four of years of college are considered to have at least a bachelor’s degree.
Most of a person’s characteristics refer to the individual’s characteristics at the time of the survey or March of the year. However, annual earnings, household income and poverty status are based on the respondent’s income characteristics in the calendar year prior to the survey.
The figures on the net worth of households in Chapter 1 were tabulated from the U.S. Census Bureau’s Survey of Income and Program Participation (SIPP). SIPP has consistently collected detailed data on household asset and liabilities since 1984. The Census Bureau has periodically published reports on the nation’s net worth in its P70 report series. For further details, see Gottschalk (2008).
Dollars figures in the report were converted to 2012 dollars using the research series of the consumer price index (CPI-U-RS).
Survey Methodology:
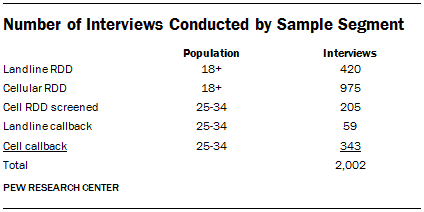
Results for the Pew Research Center survey are based on telephone interviews conducted October 7-27, 2013 among a national sample of 2,002 adults 18 years of age or older living in the United States (a total of 479 respondents were interviewed on a landline telephone, and 1,523 were interviewed on a cell phone, including 929 who had no landline telephone). The survey was conducted by interviewers at Princeton Data Source under the direction of Princeton Survey Research Associates International (PSRAI). Interviews were conducted in English and Spanish. A combination of landline and cell phone random digit dial (RDD) samples were used; both samples were provided by Survey Sampling International. The landline RDD sample was drawn using traditional list-assisted methods where telephone numbers were drawn with equal probabilities from all active blocks in the U.S. The cell sample was drawn through a systematic sampling from dedicated wireless 100-blocks and shared service 100-blocks with no directory-listed landline numbers.
In order to increase the number of 25 to 34 year-old respondents in the sample additional interviews were conducted with that cohort by screening RDD cell sample and by calling back 25 to 34 year-olds from recent PSRAI surveys.
Both the landline and cell samples were released for interviewing in replicates, which are small random samples of each larger sample. Using replicates to control the release of telephone numbers ensures that the complete call procedures are followed for all numbers dialed. As many as 7 attempts were made to contact every sampled telephone number. The calls are staggered over times of day and days of the week (including at least one daytime call) to maximize the chances of making contact with a potential respondent. An effort is made to recontact most interview breakoffs and refusals to attempt to convert them to completed interviews.
Respondents in the landline sample were selected by randomly asking for the youngest adult male or female who is now at home. Interviews in the cell sample were conducted with the person who answered the phone, if that person was an adult 18 years of age or older. The additional interviews with 25- to 34-year-olds from the cell sample were administered an age screener; those who were in the target age range completed the interview. For the landline callback sample, interviewers asked to speak with the person based on age and gender who participated in an earlier survey. For the cellular callback sample, interviews were conducted with the person who answered the phone once it was confirmed that they were in the target age range.
Weighting is generally used in survey analysis to adjust for effects of sample design and to compensate for patterns of nonresponse that might bias results. The weighting was accomplished in multiple stages to account for the different sample frames as well as the oversampling of 25-34 year-olds. Weighting also balances sample demographic distributions to match known population parameters.
In the final stage of weighting, the combined sample was weighted using an iterative technique that matches gender, age, education, race, Hispanic origin, and region to parameters from the U.S. Census Bureau’s 2011 American Community Survey data. The population density parameter is county based and was derived from the Decennial Census. The sample also is weighted to match current patterns of telephone status and relative usage of landline and cell phones (for those with both), based on extrapolations from the July-December 2012 National Health Interview Survey.
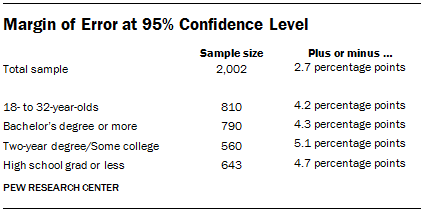
The survey’s margin of error is the largest 95% confidence interval for any estimated proportion based on the total sample – the one around 50%. For example, the margin of error for the entire sample is plus or minus 2.7 percentage points. This means that in 95 out of every 100 samples drawn using the same methods, estimated proportions based on the entire sample will be no more than 2.7 percentage points away from their true values in the population. Sampling errors and statistical tests of significance take into account the effect of weighting. The following table shows the sample sizes and the error attributable to sampling that would be expected at the 95% level of confidence for different groups in the survey:
In addition to sampling error, one should bear in mind that question wording and practical difficulties in conducting surveys can introduce error or bias into the findings of opinion polls.


