The second section presented typical adjusted household incomes for households headed by young adults ages 25 to 32. Not all 25- to 32-year-olds reside in households headed by a 25- to 32 year-old, and the likelihood of living in such a household may have changed over time. Are the patterns evident among 25- to 32-year-old heads of households not representative of the household income patterns for all young adults? No, this appendix demonstrates that the patterns evident among 25- to 32-year-old heads of households are replicated when we consider the full population of young adults.
Rather than focusing on households headed by young adults, let’s examine the adjusted household incomes of all young adults. Following Bell, Burtless, Gornick, and Smeeding (2007), the most serious shift in living arrangements that might undermine the tabulations based on heads of households is that greater proportions of Millennials are living with mom and/or dad compared with earlier generations.18 Fewer Millennials are married, but that is largely offset by the fact that more Millennials have unmarried partners.
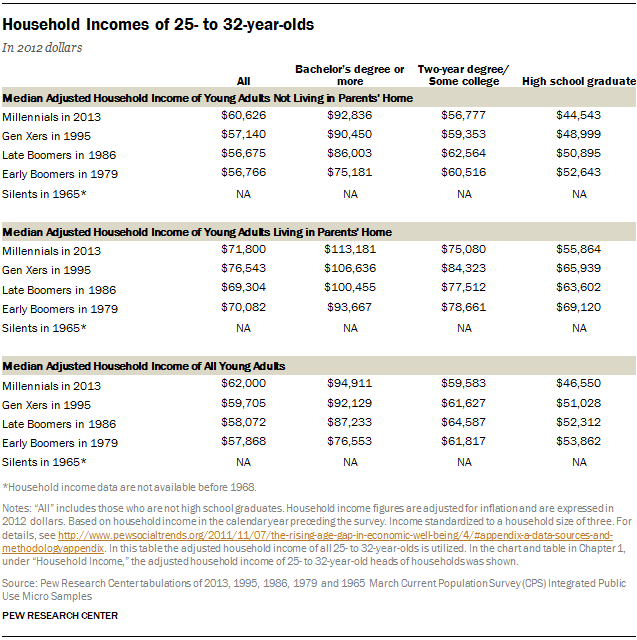
The Appendix Table below tabulates the median adjusted household incomes for the universe of young adults who are not residing with their parent(s) and those residing in the household of their parent(s). Not surprisingly, for any year-education cell the household incomes of 25- to 32-year-olds who reside in the home of their parent(s) tends to exceed the corresponding year-education group of young adults who reside independently of their parent(s).
Yes, there may have been some shifting around between marriage/cohabitation and between living with parents and living independently. The bottom panel of the table shows the adjusted household incomes of ALL 25- to 32-year-olds. Similar to the median-adjusted household income of 25- to 32-year-old heads of households, the household income of all young adults.
- Exhibit a growing dispersion by the education of the young adult from early Boomers to Millennials.
- The adjusted household income of all early Boomers in 1979 is not above the typical adjusted household income of all Millennials ages 25 to 32 in 2013.
Rather than examining household incomes, the personal incomes of young adults can be examined. These are presented in the second panel of the table in Chapter 1, under “Household Income.” Personal incomes simply reflect the total income (including sources of income other than earnings) of the young adult. Personal incomes do not account for the income contributed by other members of the household. Nor do they account for any dependents the young adult may have. Conventional measures of economic well-being (for example, poverty) are household-based and recognize that economic gains can be realized from shared living arrangements (for example, two can rent an apartment cheaper than one) and that dependents may entail some economic costs.19


