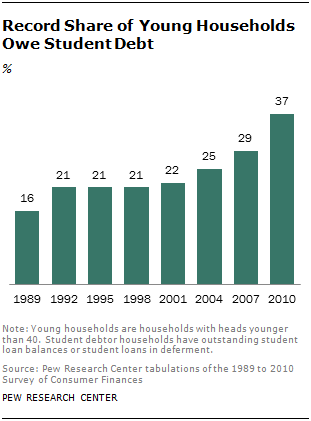
According to the most recent Survey of Consumer Finances, 37% of households headed by an adult under age 40 have outstanding student debt obligations (including loans in deferment as well as those currently being paid off), the highest share on record. The typical or median amount owed on all outstanding student loan balances is about $13,000 among young households with such debt.3 This comports closely with other recent student debt figures. Using credit report data, the New York Federal Reserve Bank reports that the median outstanding student debt balance was $12,800 per borrower owing student debt as of the third quarter of 2011 (Brown, et. al., 2012).
This new analysis by the Pew Research Center creates an overall economic profile of that record share of young households owing student debt. The analysis is unique in that rather than simply comparing households owing student debt with households that lack student debt, it takes into account educational attainment, which has an obvious impact on overall economic well-being. Households owing student debt are de factobetter educated and tend to have higher incomes than households without student debt. About half of young households owing student debt are headed by a college graduate, while only 35% of young households overall are college educated.
In addition, households not owing student debt are composed of two very different groups of people: those who are college educated but either never borrowed to finance their education or borrowed and paid off their debt, and those who have never pursued postsecondary education.
For these reasons, throughout much of the report student debtor households are compared with households with no student debt within the broad education groups of households with a college-educated head and households not headed by a college graduate. Doing so alleviates the tendency to conflagrate the role of student debt with the higher incomes of student debtors.
The Income and Wealth of Student Debtors
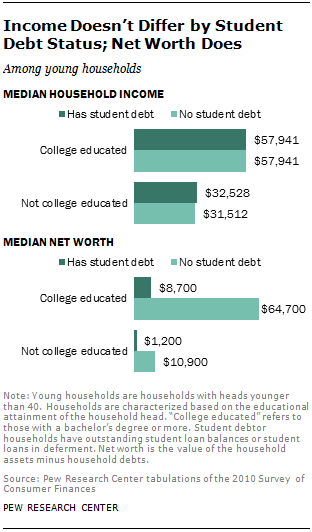
The typical household income of student debtor households within these broad educational categories is virtually identical to households without student debt. The median household income of the young and college educated is about $58,000 regardless of student debt. Among less-educated households, median household income is approximately $32,000 regardless of student debt obligations.
But there is a second important metric in understanding a household’s overall economic situation: its net worth. While income is what a household receives annually, net worth is the household’s nest egg, or what it has accumulated over time. Formally, net worth is the value of the household’s assets (both nonfinancial assets, for example, homes and cars, as well as financial assets) minus the value of all the household’s debts, or what it owns minus what it owes.
Most young households have very modest amounts of wealth because it takes time to accumulate assets. But young student debtor households have much less wealth than their peers not owing such debt. Among the college educated, those lacking student debt had a median wealth of $64,700 in 2010.4 By comparison those owing student debt had a median wealth of only $8,700. Among households headed by a young adult without a bachelor’s degree, those with no student debt had a median net worth of $10,900, while those with student debt had about a tenth of that ($1,200).
In sum, student debtors have very similar incomes but much lower net worth than households not owing student debt.
The Assets and Debts of Student Debtors
Do student debtors have less wealth because they have more debts, fewer assets, or both? Student debtors clearly tend to have a higher overall debt load than those without any outstanding student debt, and their greater indebtedness is only partly attributable to their student loans. The typical young household owing student debt has about $13,000 in outstanding education debt. The differences in total indebtedness surpass that amount.
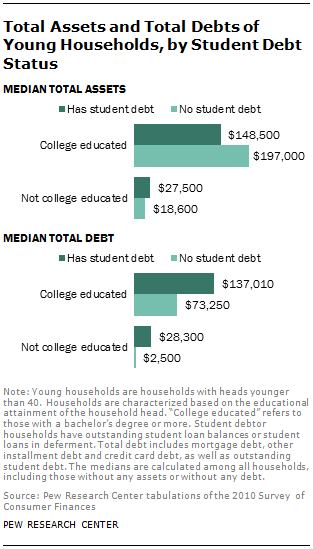
The typical total indebtedness of young, college-educated households owing student debt ($137,010) is nearly twice that of their counterparts not owing student debt ($73,250). These debts include all types of debt: mortgage debt, vehicle loans and credit card debt, as well as student debt. Among young less-educated households, the difference in indebtedness is even more stark. Less-educated student debtors owed about $28,300 in total, compared with $2,500 among those without education debt.
On the asset side, the median differences are not uniform. Among college-educated households, student debtors own fewer total assets ($148,500) than those lacking student debt ($197,000). But among households headed by a young adult without a bachelor’s degree, student debtors tend to have more total assets ($27,500) than those without student debt ($18,600).
Debt Measures
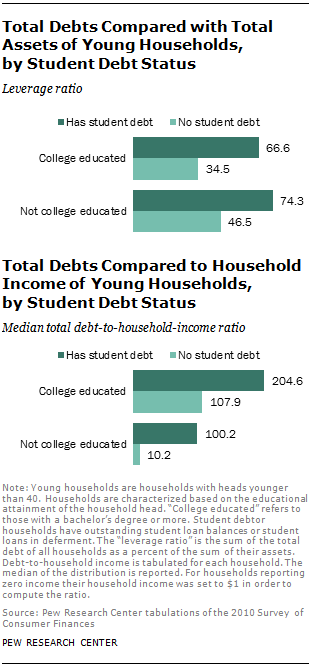
Indebtedness should be evaluated in the context of the household’s wider finances. One common measure is the leverage ratio, a simple comparison of outstanding debts to household assets. Younger households tend to be more highly leveraged than older households, and student debtor households tend to be more leveraged than households that do not owe student debt.5 Among the young and college-educated, student debtor households are nearly twice as leveraged as their counterparts lacking student debt—67% vs. 34%. Overall, leverage is higher among younger households whose heads do not have a bachelor’s degree. And within those households, those owing student debt are more highly leveraged than those not owing student debt (74% of total assets vs. 47%, respectively).
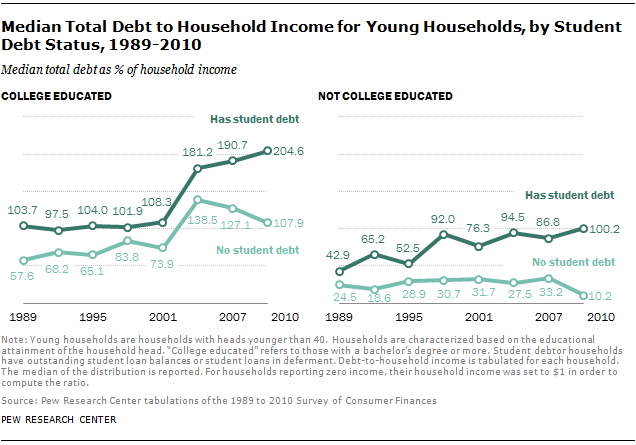
This leverage ratio is a group-wide average that does not take account of the distribution of debt among households.6 An alternative approach would be to compare each household’s debts to its income and examine the median debt-to-income ratio. In other words, how many years of income would the typical young household require to pay off all its debts? If the household head is college educated and owes student debt, it would take a little over two years of household income (205%) to retire all debts. For the typical college-educated household with no student debt, it would take about half this time (a little over a year of its income, or 108%). Among less-educated households owing student debt the typical household has indebtedness exactly equal to a year’s worth of household income (100%). Their counterparts without student debt would need only a tenth of a year of household income to retire all debts (10%).
Trends in Overall Indebtedness
Aggregate household debt over all households peaked in 2008 (Brown, et. al., 2010). In spite of rising student debt, it has been younger households who have been in the vanguard of reducing debt in the aftermath of the Great Recession (Fry, 2013). A basic reason for this is that the retreat from homeownership since 2004 has been led by younger families (Emmons and Noeth, 2014). If the family does not own its home, it does not have a mortgage and is therefore free of the largest component of household debt.
Judged on the basis of the typical debt-to-income ratio, the decline in household indebtedness among younger households has not been uniform. Among college-educated households owing student debt, the typical debt-to-income ratio increased from 191% in 2007 to 205% in 2010. By contrast, the debt-to-income ratio of college-educated households without student debt obligations fell from 127% in 2007 to 108% in 2010. A similar divergence in the trends in indebtedness is evident among less-educated households. The only young households that have experienced a decrease in their debt-to-income ratio since 2007 are those without student debt.
Financial Distress
By a number of benchmarks, young student debtors appear to be experiencing greater financial stress than comparable households lacking education debt.
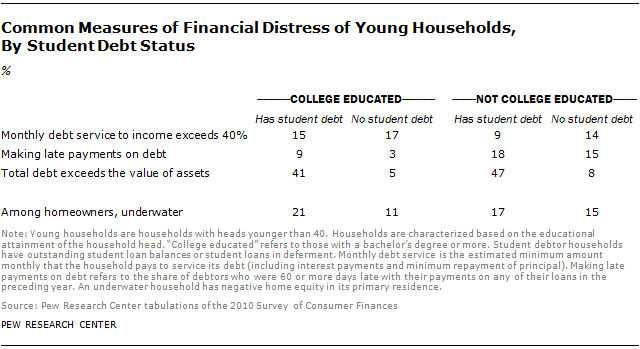
The median young household with debts spends about 18% of monthly household income to service those debts. A common benchmark of financial distress is when households must devote more than 40% of monthly income to repay debts (Bricker, et. al., 2012; Chiteji, 2007). Under this criterion, student debtors do not seem to be disproportionately burdened. Among young, college-educated households, about 15% of student debtors exceed the 40% threshold. Among those lacking student debt, 17% of households exceed the 40% threshold. Among young and less-educated households, those lacking student debt are more likely to be devoting large amounts of their monthly income to debt service (14%) than student debtors (9%). Student debtors include households whose student loans are currently deferred, however. The monthly debt payments of student debtors currently in repayment is not available.
Student debtors do seem to have more difficulty making timely debt payments. About 9% of college-educated student debtors were 60 or more days late with their payments on any of their loans. By comparison, only 3% of similarly educated debtors lacking student debt were late in their payments.
In theory, a household can liquidate its assets in order to pay off outstanding debts. By this measure, young, heavily leveraged student debtors are clearly in a more financially precarious position than other young households. About four-in-ten college-educated student debtors possess total debts exceeding the value of their assets, hence asset liquidation will not entirely meet their outstanding debts in the event of job losses and other unforeseen economic shocks. Among their counterparts without student debt, only 5% have outstanding debts in excess of current assets. Similar wide divergence in the incidence of negative net worth (debts in excess of assets) is apparent among less-educated young households (47% versus 8%).
Finally, we can examine distress in the housing market. A minority of young adult households own their primary residence. But, when they do, student debtors are more likely than households without student debt to be “underwater,” i.e., the outstanding mortgage balance as well as other loans secured by the primary residence exceeds the value of the residence. For example, 21% of college-educated student debtors are underwater on their primary residence, compared with 11% lacking student debt.7
The Specifics of Debt
A household’s total debts can be broken down into six major debt categories: debt secured by residential property, vehicle loans, student loans, other installment debt, credit card debt, and other debt. Without exception, young student debtors are at least as likely as young non-student debtors to owe each type of debt, and they are often more likely to have such debts.
Among young households headed by a college graduate, those with student debt are more likely than non-student debtors to have outstanding vehicle debt (43% vs. 27%), significantly more likely to have credit card debt (60% vs. 39%), and just as likely to have housing-related debt (56%).
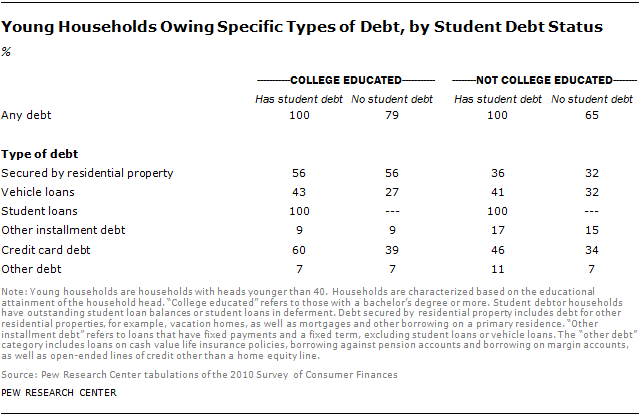
Among young households whose heads lack at least a bachelor’s degree, student debtors are more likely than those without student debt to owe on vehicle loans, credit card debt and other types of debt and are just as likely to have a mortgage and other installment debt.
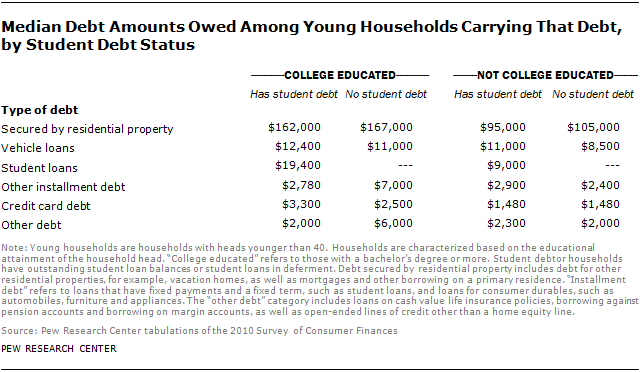
In regard to the outstanding amounts of debt, there do not appear to be notably large differences between student debtors and others in the specific types of debt. Obviously student debtors owe student debt and others do not, but for the other five types of debt, differences at the median in the outstanding balances are modest.8
Public Opinion Findings
A Pew Research Center survey conducted in late 2013 found a significant link between student debt and economic well-being. Young adults who took out loans to finance their educations are less satisfied overall with their personal financial situation than are those who did not borrow money for college.
Among adults ages 18 to 39 with two- or four-year degrees who borrowed for college, 70% say they are satisfied with their personal financial situation. Fully three-in-ten (29%) are not satisfied with their personal finances. By comparison, 84% of young, college graduates who did not take out student loans say they are satisfied with their personal financial situation, while only 14% are dissatisfied.
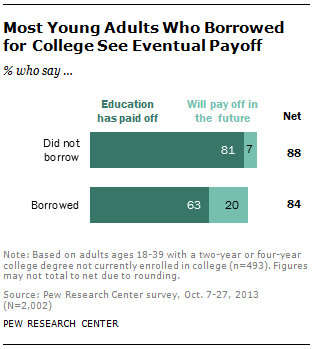
Whether or not they borrowed money for college, most young college graduates say the investment they made in their education has paid off. However, the survey findings suggest the payoff may be more immediate for those who did not take out student loans. Survey respondents were asked whether their college education had paid off for them financially, given what they and their families paid for that education. Young adults who had taken out student loans to finance their education were less likely than those who did not borrow for college to say that their education has paid off.
Among young adult college graduates who borrowed money for college, 63% say the investment they made in their education has paid off. By comparison, among those who did not borrow money for college, 81% say college has paid off for them. Overall, 84% of young college graduates who borrowed money for school say that college has either paid off for them or will in the future.


