In this section, the adult population is divided into three groups, based on their marital status and marital history: those in their first marriage, those who are currently remarried,13 and those who are divorced but not currently remarried.14
Looking first at gender patterns, women are overrepresented among divorced adults15—57% of divorced adults in 2013 were women and 43% were men. This partially reflects the fact that previously married men are more likely to remarry than previously married women.
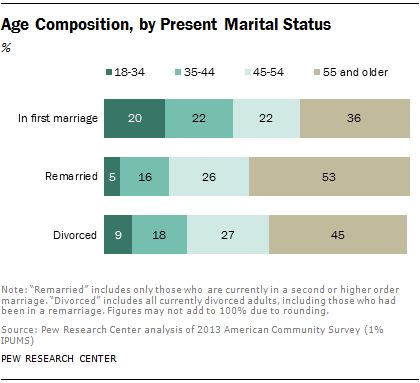
Not surprisingly, adults who are in their first marriage are quite a bit younger than those who have already entered a marriage, exited that marriage and entered into another. Divorced adults fall in the middle—older than those in their first marriage, but slightly younger than remarried adults.
Two-in-ten adults in their first marriage are younger than 35, compared with 5% of remarried adults and 9% of those who are divorced. And while about half (53%) of remarried adults are ages 55 or older, this share is 45% among divorced adults and just 36% among those in their first marriage.
These age patterns may be contributing to differences by education, race and ethnicity across marital groups.
Adults in their first marriage are more highly educated than either those in a subsequent marriage or those who are divorced. More than one-third (35%) of adults in their first marriage have a college degree, compared with 25% of remarried adults and 23% of those who are presently divorced. And while about two-thirds of remarried and divorced adults have earned a high school diploma only, this share is 53% for adults in their first marriage.
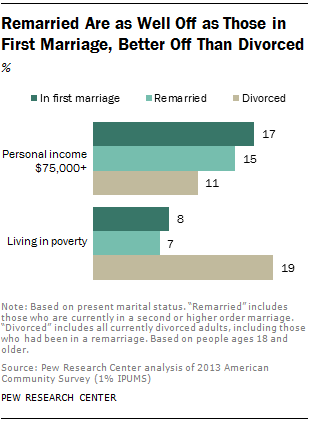
When it comes to financial well-being, married adults—whether in their first marriage, or a subsequent marriage—have similar profiles, and are somewhat better off than their divorced counterparts.16 Median annual personal income is $30,000 for those in their first marriage and $30,000 for remarried adults. Among adults who are presently divorced, annual income is substantially less: $25,100. And while 8% of adults in their first marriage and 7% of those who are remarried are living in poverty, the share is more than twice as high for divorced adults, 19% of whom are living below the poverty line.
There are also stark differences across these groups in rates of homeownership. Divorced adults are much less likely than their married counterparts to own a home.17 Three-fourths of adults in their first marriage own their home, as do 79% of remarried adults. In contrast, just 58% of those who are currently divorced are homeowners.
Remarried adults are disproportionately white. While 79% of the remarried are white, this number is 69% among adults in their first marriage and 71% among the divorced. By the same token, adults in their first marriage are slightly more likely to be Hispanic (15%) than adults who are remarried (9%). Divorced adults include a relatively large share of blacks (14%), compared with each married group (8% among first-time marrieds, 9% among remarrieds). Asians, on the other hand, are particularly prevalent among adults married for the first time. Some 7% of this group is Asian, compared with 3% of remarried and divorced adults.


