The shrinkage of the middle-income tier among American adults, and the growth of the upper- and lower-income tiers, has played out differently among demographic groups. This section identifies upwardly and downwardly mobile groups (winners and losers) by comparing changes in their income status over two time periods.
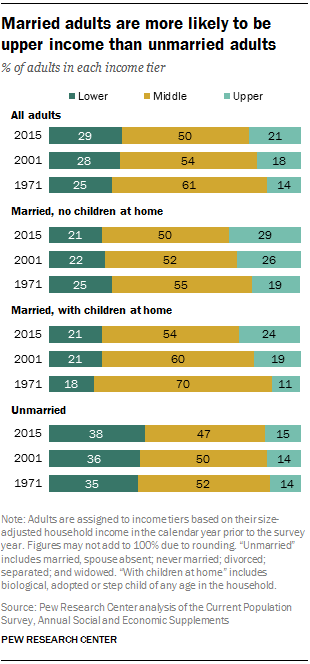
From 1971 to 2015, adults overall experienced more movement up the economic ladder than down the ladder. The upper-income share increased 7 percentage points, from 14% to 21%, and the lower-income share increased 4 percentage points, from 25% to 29%. Thus, the net gain in income status from 1971 to 2015 is 3 percentage points.
The gain in economic status was more modest in the shorter term. From 2001 to 2015, the share of adults in the upper-income tier increased 3 percentage points, from 18% to 21%, and the share in the lower-income tier increased 1 percentage point, from 28% to 29%. The net gain in income status from 2001 to 2015 is 1 percentage point (calculated before rounding).
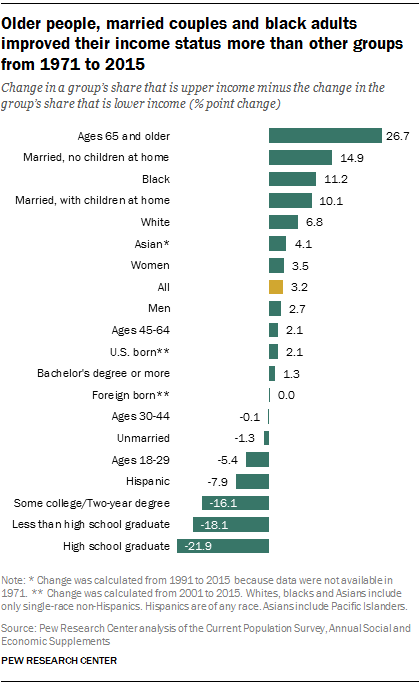
The biggest winners overall are people ages 65 and older. They are most likely to have moved up the income ladder since both 1971 and 2001. They are less likely to be lower income and more likely to be upper income than they used to be. Other age groups gained only slightly or lost ground.
Among the contributors to increased income status of older adults is that relatively more of them are working.20 In addition, Social Security continues to provide a reliable source of income – more than 55% of total income on average – and is linked to the long-term decline in poverty among older adults.21 Despite their improving economic status, though, older adults lag behind adults overall in the shares that are middle income or upper income.
Married adults, whether with or without children at home, also were winners, while their unmarried counterparts lost ground. (This is somewhat related to the differences by age, since married adults tend to be older than unmarried adults.) U.S.-born adults gained more ground than foreign-born adults. And women, helped by their increasing educational attainment, fared somewhat better than men.
This section also explores differences by race and ethnicity, educational attainment, occupation and industry.
Gender and marriage: Married adults (both with and without children at home) are more likely than unmarried adults to live in upper-income households and less likely to be in lower-income households. Married adults overall moved up the income ladder since 2001 and over the past four decades, while unmarried adults slipped slightly during both periods.
One factor explaining this divergence is that marriage increasingly is linked to higher educational attainment, and higher education offers the highest financial rewards.22 And, in fact, among married couples, the largest gains have been among those where both spouses work.
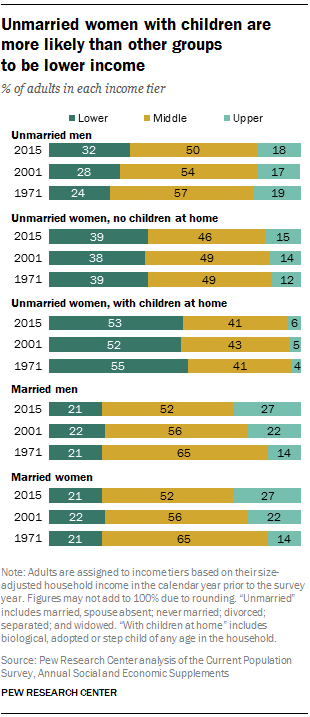
The loss among unmarried adults was concentrated among men, in both time periods.23 The income status of unmarried men slipped from 2001 to 2015 because their lower-income share rose more than their upper-income share. Over the longer term, from 1971 to 2015, unmarried men became more likely to live in lower-income households and slightly less likely to live in upper-income households.
The decline in men’s economic status has occurred during an era in which women’s earnings growth and educational attainment have outpaced those of men.24 Despite these changes, unmarried men have higher economic status than unmarried women; they are more likely to be in the upper-income tier and less likely to be in the lower-income tier.
Among unmarried women, those with a child at home are less likely than those without a child at home to be in the upper-income tier and more likely to be in the lower-income tier. More than half of unmarried women with a child at home (53% in 2015) are in the lower-income tier, compared with 39% of their counterparts without children at home.
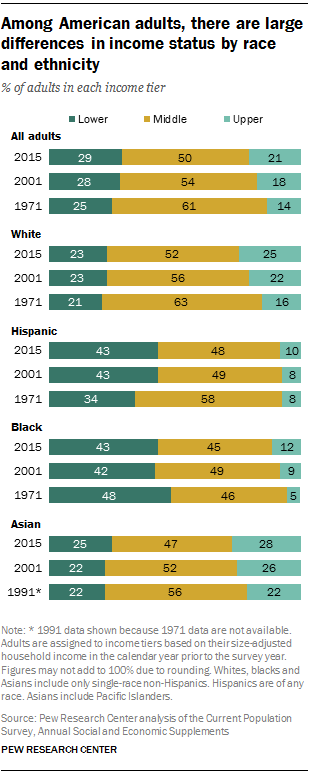
Race/ethnicity and nativity: White and Asian adults are more likely than black and Hispanic adults to be in the upper-income tier, and they are less likely to be in the lower-income tier. Since 2001, blacks, Hispanics and whites have all experienced a small increase in income status – that is, their share in the upper-income tier bumped up, while their share in the lower-income tier was flat (for whites and Hispanics) or ticked up by 1 percentage point (for blacks). The income status of Asians ticked down from 2001 to 2015 due to slightly more growth in the lower-income tier than the upper-income tier.
Over the longer term, black adults sustained the largest increase in income status from 1971 to 2015 and were the only major racial or ethnic group to experience a decline in their lower-income share. The share living in lower-income households among black adults declined from 48% in 1971 to 43% in 2015, and the share of upper-income households grew to 12% from 5% over the same period. This progress notwithstanding, blacks are still significantly less likely than adults overall to be middle income or upper income.
Hispanic adults have slipped down the income ladder since 1971, driven by an increase from 34% to 43% in their lower-income share. This is likely due to the rising share of immigrants in the Hispanic adult population, from 29% in 1970 to 49% in 2015. Economically, Hispanic immigrants trail U.S.-born Hispanics, as covered below.
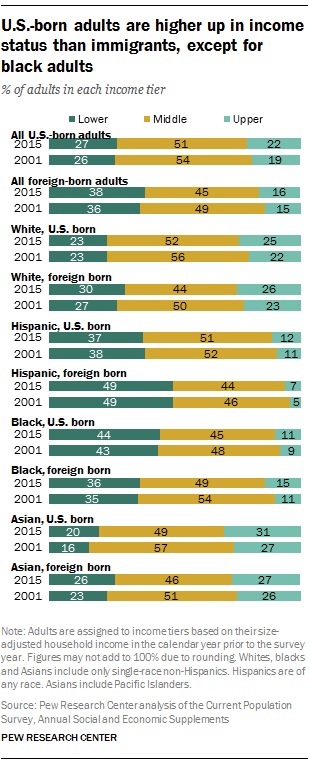
White adults have moved up in income status since 1971, due to higher growth at the top than the bottom of the income distribution. Asians experienced a rise in income status since 1991, the first year for which data have become available.
In terms of differences by nativity, foreign-born adults are more likely than U.S.-born adults to be lower income (38% to 27% in 2015), and less likely to be upper income (16% to 22%). Overall, U.S.-born adults had a small rise in income status since 2001, while foreign-born adults had no change in their income status. Among U.S.-born adults, only Asians experienced a small loss in income status since the turn of the century.25
Foreign-born Asians also experienced a small loss in income status. However, foreign-born black and Hispanic adults sustained increases in income status since 2001. One factor behind the short-term trends for Hispanic adults could be the slowdown in immigration from Mexico, especially of unauthorized immigrants, who tend to be less educated.26 Among black foreign-born adults, a recent wave of immigration has helped to increase the educational attainment of this group (and though median household income has declined, the decrease is about equal to that of the population overall).27
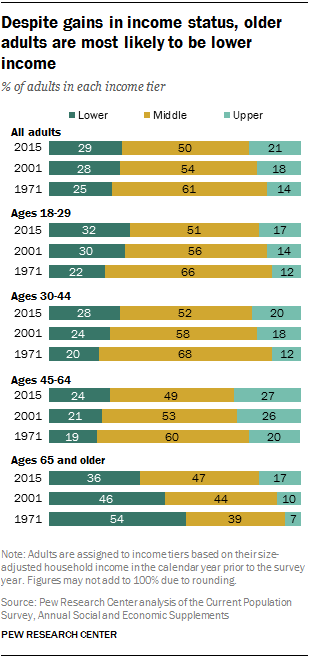
Age: Americans ages 65 and older have been the greatest economic gainers in this century, as well as in the four decades since 1971. They were the only age group that had a lower share who were lower income in 2015 (36%) than in 2001 (46%), or in 2015 than in 1971 (54%), and the decline has been notable. The share of older adults in the upper-income tier grew more than that of any other age group during both time periods. (Older adults also were the only age group where the share in the middle-income tier grew during both eras.) Despite these gains, only 17% of older adults were in the upper-income tier in 2015, the same as the share of young adults ages 18 to 29 and less than other age groups.28
Other age groups experienced either smaller gains in income status or no change or losses during both periods. Since the turn of the century, no age group other than older adults decisively climbed the income ladder. Young adults, ages 18 to 29, essentially stayed even from 2001 to 2015: Their share in the upper tier grew by only 1 percentage point more than their share in the lower tier.
Young adults have slipped down the income ladder since 1971, with the share in the lower-income tier climbing substantially to 32% in 2015 from 22% in 1971.
Middle-age adults (ages 30 to 44 and 45 to 64) have lost ground in income status since the turn of the century, experiencing more growth in the lower-income tier than the upper-income tier. Over the longer term, from 1971 to 2015, the income status of 30- to 44-year-olds has been flat. The distribution of 45- to 64-year-olds has moved upward in recent decades; 27% of this group was upper income in 2015, compared with 20% in 1971.
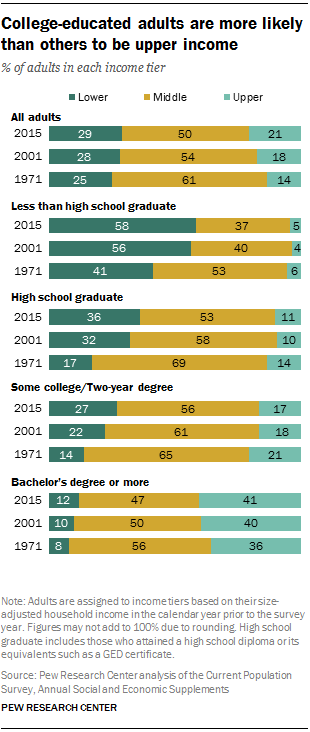
Education: There were no income status winners among educational attainment groups from 2001 to 2015, though the least educated adults (those with less than a high school diploma) and the most educated adults (those with at least a college degree) had the smallest losses. However, from 1971 to 2015, only one educational attainment group did not lose income status: college graduates.
College graduates also have higher income status than other groups. They are eight times as likely as adults who did not graduate from high school to live in upper-income households, and they are more than twice as likely as high school graduates or adults with some college education to be in the upper-income tier. The share of college graduates in lower-income households has grown to 12% in 2015, but this is a fraction of the share of less-educated adults who live in lower-income households.
As the U.S. economy increasingly rewards those with job skills, college-educated Americans have an economic edge over other adults, even when the costs of going to college are factored in. They have a growing earnings advantage over those with no more than a high school diploma.29 Even recently, when wages of college-educated adults have declined, those of less-educated adults have declined more, so college-educated adults preserved their advantage.30
These changes have taken place as educational attainment of the overall U.S. population has risen to record levels.31 Even though no individual educational attainment category gained income status since the 21st century began, the rise in overall educational attainment contributed to a narrow societal gain in income status.
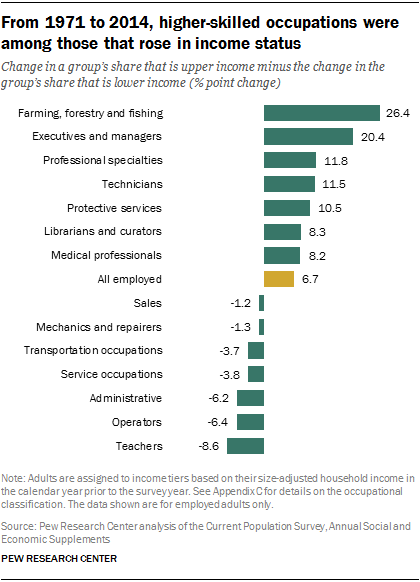
Occupation: The change in income status among occupations of employed adults matches data that show growing wage inequality over time.32 Beginning in the early 1990s and intensifying during the following decade, jobs increasingly have been concentrated in high-skilled and low-skilled occupations.33
Several of the occupational categories that experienced the largest increase in income status are those that demand high skills and those whose share of total employment has grown in recent decades. They include executives and managers; professional specialty jobs such as engineers; and medical professionals such as physicians and radiology technicians. These occupational groups all moved up the income tier ladder from both 1971 to 2014, and since the turn of the century.34
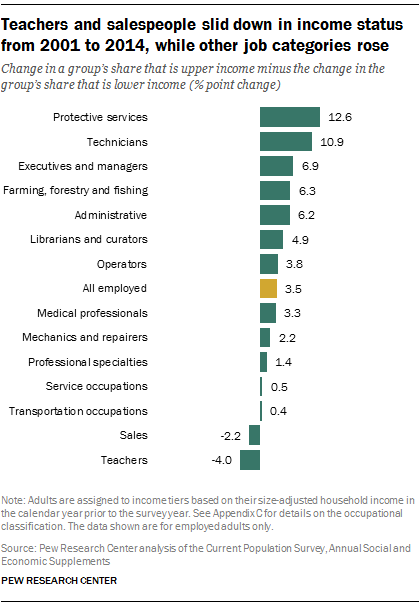
The improving economic status of farming occupations is also notable. That has occurred in the context of an industry that has steadily improved productivity and wages as it moved from small, labor-intensive farms to large, mechanized and more specialized farms.35 Nonetheless, farming and fishing occupations were about twice as likely to be lower income and about half as likely to be upper income as employed adults overall in 2015.
Other job categories with growing shares of employment did not fare so well. Teachers, a category that includes all levels of instruction, have lost ground since 1971 and since the turn of the century. Sales occupations, which encompass retail clerks as well as real estate agents and others, ticked downward in income status in both periods.
Job groupings with shrinking shares of overall employment generally lost income status since 1971. These include mechanics, laborers and transportation occupations, although these all have improved income status or their income status stayed steady since the turn of the century. The same trend is true of administrative support, a category with shrinking employment shares that includes typists and file clerks.
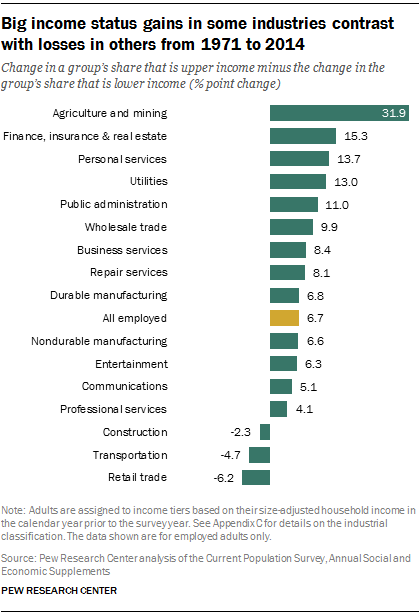
Industry: Looking at income status change by industry, overall employment shares in half a dozen sectors have declined over the past four decades, even as income status climbed in the long term and since the turn of the century.36 Among these sectors are manufacturing; agriculture and mining; utilities; wholesale trade; and personal services. Manufacturing accounted for 26% of employed adults in 1971, compared with 11% in 2014. In 1971, 15% of workers in nondurable goods manufacturing and 16% of workers in durable goods manufacturing had upper-tier incomes, compared with 26% and 27% who did so in 2014, respectively.37
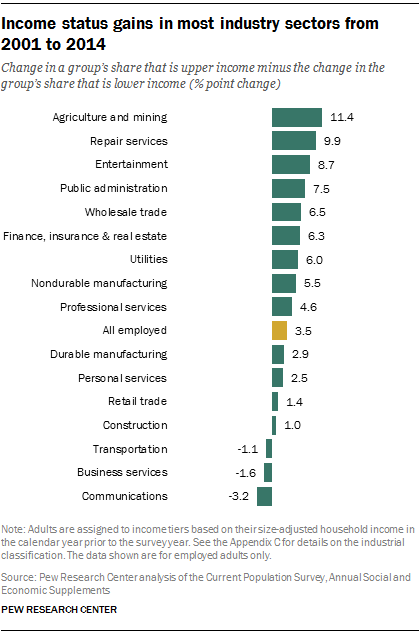
These changes have taken place within a larger context of change in the manufacturing workforce, where the sector itself has shrunk and the jobs within it increasingly are high-skilled work.38 As noted, the move to bigger, more mechanized farms has led to large improvements in productivity and wages in agriculture. But workers in agriculture and mining are more likely to be lower income and less likely to by upper income than employed adults overall in 2015.
In other industry sectors, employment shares and income status both have grown. Among these sectors are professional services, a category that includes hospitals, clinics and schools. This sector employed 29% of U.S. working adults in 2014, compared with 18% in 1971. About a third of workers in this sector (32%) were upper income in 2014, compared with 26% in 1971. Other sectors that have had employment growth and income status growth are entertainment and finance, insurance and real estate.
Among the sectors where income status has declined since the turn of the century are business services, communications and transportation. In the communications sector, for example, 11% of employed workers were in the lower tier in 2001, and 12% were in 2014. An additional 37% were in the upper-income tier in 2001, compared with 36% in 2014.


