A Pew Research Center report released in December found that there are now roughly as many adults in middle-income households as in lower- or upper-income households – a decided shift from four decades ago, when middle-income Americans were clearly in the majority. Moreover, the nation’s aggregate household income has substantially shifted from middle-income to upper-income households since 1970.
In many ways, the attitudes of self-described middle-class adults reflect those of the country as a whole.1 They have similar assessments of the way Barack Obama is handling his job as president, they are largely dissatisfied with the way things are going in the country today, and they echo the public’s concerns about terrorism and national security. When it comes to the state of the economy, the views of middle-class adults are in line with those of the general public – strong majorities say economic conditions in the country are only fair or poor.
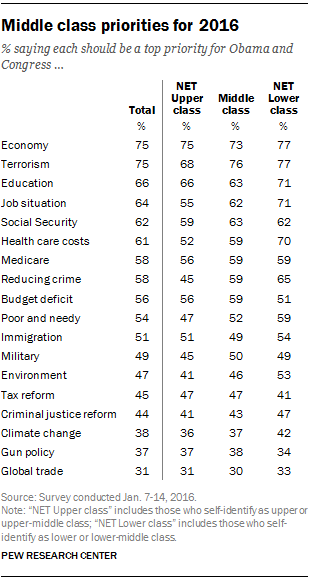
Looking ahead, the middle class expresses similar policy priorities for 2016 as the general public. (For more on 2016 priorities, see “Budget Deficit Slips as Public Priority,” released Jan. 22, 2016.)
About three-quarters of those who identify as middle class say defending the country from future terrorist attacks (76%) and strengthening the economy (73%) should be top priorities for Obama and Congress in 2016 – the same top two priorities identified by the general public.
When it comes to reducing crime, middle-class adults are more likely than those who identify as upper or upper-middle class to say crime should be a top priority (59% vs. 45%). About two-thirds (65%) of those who identify as lower or lower-middle class give top priority to reducing crime.
Across class lines, those who identify as lower-middle or lower class are the most likely to say improving the job situation (71%) and reducing health care costs (70%) should be top priorities for Obama and Congress in 2016.
When it comes to what it takes to be middle class, there is near unanimity in the public that a secure job and the ability to save money are essential for middle-class status. At the same time, there are sharp differences in opinion across classes regarding the availability of good jobs. Majorities of self-identified middle-class (58%) and lower-class adults (73%) say that good jobs are difficult to find, compared with only 46% of upper-class adults.
Views on Government Help for Middle Class, Wealthy and Poor
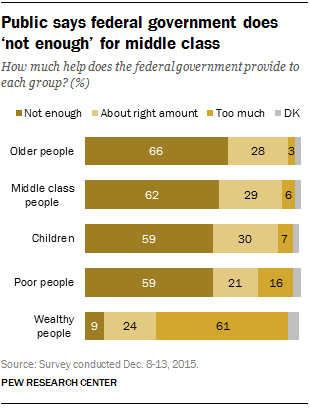
A clear majority of Americans say the federal government does not do enough to help the middle class, but the middle class is hardly alone on this list. Majorities also say the government doesn’t do enough for older people, poor people or children.
Overall, 62% say the government doesn’t do enough to help the middle class, while 29% say it does about the right amount and 6% say it does too much. Roughly the same share (59%) says the government does not do enough for poor people or for children (59% each), and 66% say the government doesn’t do enough to help older people.
Wealthy people are the one group included in the survey for which the public thinks the government does too much: 61% say this, while 24% say the government does about the right amount and 9% say it does not do enough.
Republicans and Democrats differ significantly in views of how much help the government gives the wealthy and poor. But there is greater consensus across party lines when it comes to the middle class, with most in both parties saying the government does not do enough for this group.
Fully 77% of Democrats say the government does too much for wealthy people, while 12% say it does about the right amount and 9% say it doesn’t do enough. Among Republicans, views are more mixed: 44% say the government does too much to help the wealthy, 39% say it does about the right amount and 9% say it does not do enough.
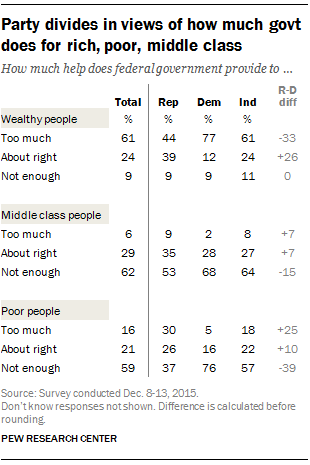
When it comes to the middle class, 68% of Democrats and 53% of Republicans say the federal government does not do enough to help middle-class people. Few Republicans (9%) or Democrats (2%) say the government does too much for the middle class.
Middle-class Americans who identify with the Democratic Party or lean Democratic are more likely than those who are Republican or lean to the GOP to say the government does not do enough to help the middle class. Among Democrats and Democratic leaners who say they are middle class, fully 71% say the federal government does not do enough to help middle-class people. By comparison, 50% of Republican and Republican-leaning middle-class adults say the same.
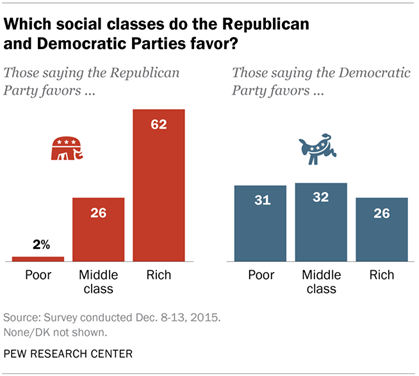
No consensus on which social class Democratic Party favors; most say GOP favors the rich
Overall, roughly a third of adults (32%) say the Democratic Party favors the middle class over the rich and the poor. A nearly identical share (31%) says the Democratic Party favors the poor, and 26% say it favors the rich. Young adults (those under 30) are among the most likely to view the Democratic Party as favoring the middle class: 40% say this, while about a quarter say the party favors the rich (25%) or the poor (24%). Older age groups are more mixed in their views, with no more than a third saying the Democratic Party favors the middle class.
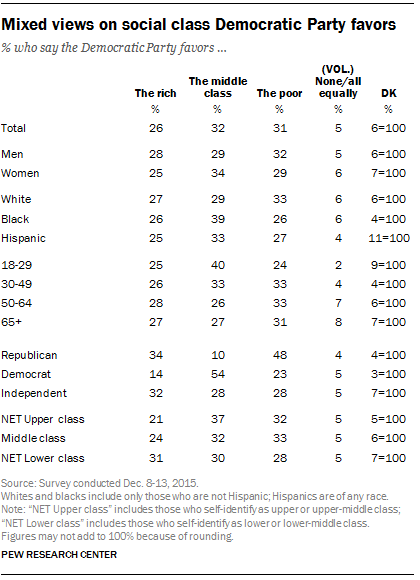
Among Democrats themselves, 54% say their party favors the middle class over the rich or the poor. Some 23% of Democrats say the Democratic Party favors the poor and 14% say it favors the rich. Republicans hold much different views: About half (48%) say the Democratic Party favors the poor, while 34% say it favors the rich and just 10% say it favors the middle class. Independents are split in their perception of the Democratic Party: 32% say it favors the rich, while 28% each say it favors the middle class or poor.
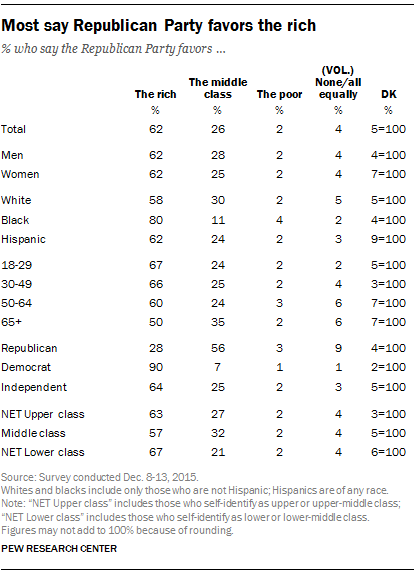
Across demographic groups, views on which class the Republican Party favors often run in the opposite direction as patterns seen in views of the Democratic Party.
Across age groups, the oldest adults (ages 65 and older) are the most likely to see the GOP as favoring the middle class: 35% say this, compared with 24% of those 50-64, 25% of those 30-49 and 24% of those 18-29.
Among Republicans, 56% say their party favors the middle class; this percentage is comparable to the 54% of Democrats who say the same about their own party. About three-in-ten Republicans (28%) say the GOP favors the rich and just 3% say it favors the poor. Among Democrats, fully 90% say the Republican Party favors the rich, while just 7% say it favors the middle class. And a quarter of independents (25%) say the GOP favors the middle class – roughly on par with the 28% who say this of the Democratic Party – while 64% of independents say the GOP favors the rich.
Among middle-class adults themselves, 32% say the Republican Party favors the middle class – identical to the share of them saying the Democratic Party favors this group; 57% of those in the middle class say the GOP favors the rich.
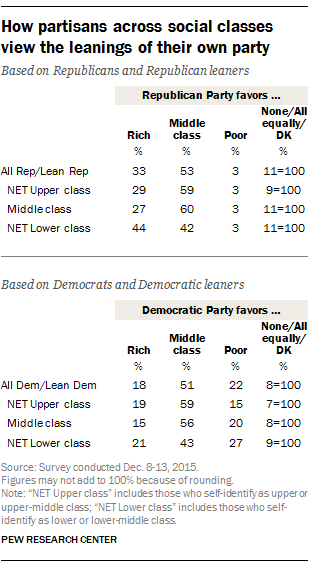
Six-in-ten middle-class adults who identify or lean toward the Republican Party (60%) say the GOP favors the middle class. A similar share (56%) of those in the middle class who identify or lean Democratic say their party favors the middle class.
Both Republicans and Democrats who identify as lower class are less likely to say their own party favors the middle class than are those in their party who consider themselves higher up the class ladder. Among Democrats and Democratic leaners, 43% of those who say they are lower class say their party favors the middle class, compared with 59% of those who say they are upper class. Similarly, 42% of Republicans and Republican leaners who identify as lower class say the party favors the middle class, while 59% of those who say they are upper class say the same.
Life satisfaction and views of personal finances across social classes
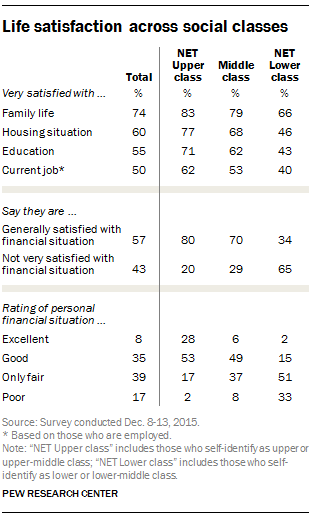
Assessments of life satisfaction differ across self-identified social classes, with some of the widest differences seen between the views of the lower class and those of the upper and middle classes.
Majorities across groups say they are very satisfied with their family life. However, somewhat greater shares of those in the upper class (83%) and middle class (79%) say this than of those in the lower class (66%).
About three-quarters of upper-class adults (77%) say they are very satisfied with their present housing situation; 68% of those in the middle class also say this. Among lower-class adults, far fewer (43%) say they are very satisfied with their current housing.
Similarly, most upper- (71%) and middle-class adults (62%) say they are very satisfied with their education, compared with 43% of lower-class adults.
Among those currently employed, 62% of upper-class adults say they are very satisfied with their current job, while about half of those in the middle class (53%) say they are very satisfied with their job. Among employed adults who describe themselves as lower class, 40% say they are very satisfied with their current job.
By an 80%-20% margin, more upper-class adults say they are generally satisfied with their financial situation than say they are not very satisfied with it. Among those in the middle class, far more say they are generally satisfied (70%) than not very satisfied (29%) with their financial situation. But the picture is much gloomier among the lower class: Just 34% say they are generally satisfied with their financial situation, while 65% say they are not very satisfied.
While large majorities of upper- and middle-class adults say they are generally satisfied financially, a gap emerges between the groups when asked for more detailed assessments of their financial state. Overall, 28% of those who describe themselves as upper class say they are in excellent financial shape, while 53% say they are in good shape, 17% say they are in only fair shape and just 2% say they are in poor shape. Ratings are somewhat less strong among the middle class: Only 6% describe their personal financial situation as excellent; a plurality (49%) say they are in good shape financially, compared with 37% who say they are in only fair shape and 8% who describe their situation as poor. Personal financial ratings among the lower class are much more negative. Relatively few lower-class adults say they are in excellent (2%) or good shape (15%) financially; about half (51%) describe their financial situation as only fair, while a third (33%) say it is poor.
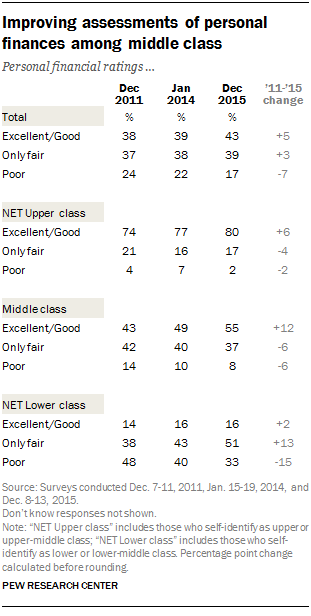
As the country has recovered from the Great Recession, assessments of personal finances have improved across most groups, particularly among those who describe themselves as middle class.
Among the general public, the share describing their personal financial situation as either excellent or good has ticked up 5 percentage points since December 2011, while the share describing their situation as poor has declined 7 points.
Among those who say they are middle class, positive personal financial ratings are up 12 points, from 43% who described their finances as excellent or good in 2011 to 55% in the current survey.
Relatively few lower-class adults say their finances are in excellent or good shape, and there has been little change in this view since 2011. However, 51% now say their finances are in only fair shape, up 13 points from December 2011. Over this same period of time, the share of lower-class adults describing their personal financial situation as poor has declined 15 points.
Among those who are upper class, eight-in-ten describe their financial situation as excellent or good. Financial ratings among this group were already quite strong in December 2011, when about three-quarters (74%) said their finances were in excellent or good shape.
Views on cost of living across social classes
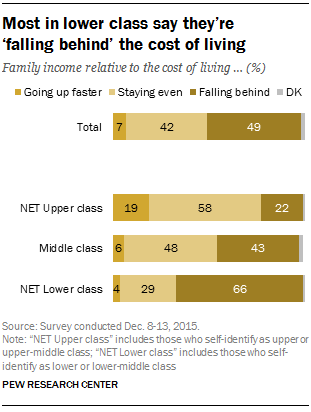
Across class lines, fully 66% of those who identify as lower class say they are falling behind the cost of living, compared with 29% who say they are staying about even and 4% who say their income is going up faster than the cost of living. Views are mixed among the middle class: 48% say their income is staying about even with the cost of living, but almost as many (43%) say it is falling behind; 6% say it is going up faster. Even among the upper class, about as many say their income is falling behind the cost of living (22%) as going up faster (19%); a 58% majority of upper-class adults say their income in staying about even with the cost of living.
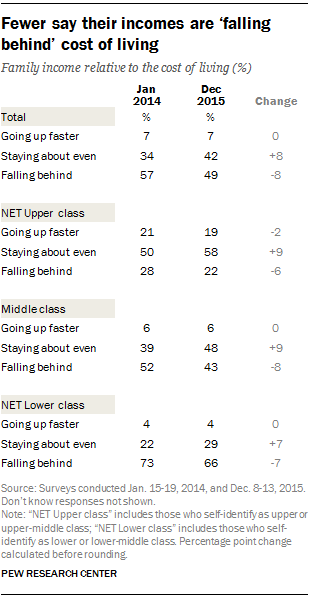
Over the past two years, the overall share of the public saying they are falling behind the cost of living has declined as the share saying they are staying about even has increased. (For more on how the public views the economy, see: “As Election Year Nears, Public Sees Mixed Economic Picture,” released Dec. 22, 2015.)
Across the social classes, there has been a comparable uptick in the share saying they are keeping up with the cost of living among those who say they are upper class (+8 points), middle class (+9 points) and lower class (+7 points).
Views of the job market across social classes
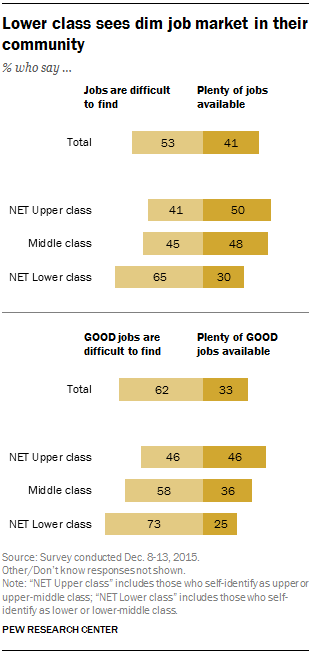
Middle-class adults are particularly likely to see a difference between the availability of jobs and good jobs in their community. About as many middle-class adults say there are plenty of jobs available in their community (48%) as say that jobs are difficult to find (45%). However, when it comes to the availability of good jobs, just 36% say there are plenty of good jobs in their community, compared with 58% who say that good jobs are hard to find.
Those who identify as lower class have the most negative view of the job market: 65% say that jobs are difficult to find and 73% say good jobs are difficult to find.
Among upper-class adults, half say that there are plenty of jobs available in their community and 41% say jobs are difficult to find. When it comes to the availability of good jobs, upper-class adults are evenly divided on whether plenty are available or they are hard to find (46% for each).
Job and ability to save are key to middle class status
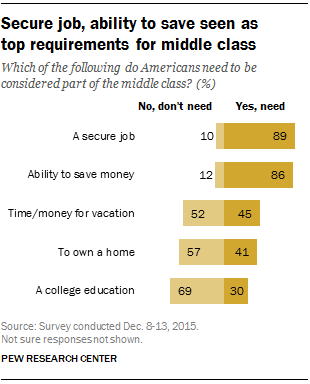
Broad majorities say that a secure job (89%) and the ability to save money for the future (86%) are needed for a person to be considered middle class. Fewer than half say having the time and money to travel on vacation (45%) and owning a home (41%) are needed for someone to be considered middle class. And while a college degree is widely seen as a key to advancement and success, just 30% say a person has to have one to be considered middle class.
Across most characteristics included in the survey, there is general agreement among the social classes on what is needed – or not needed – to be considered middle class. One exception is views about a college degree. Large majorities of upper- (78%) and middle-class (72%) adults say a college degree is not required to be considered middle class. A smaller majority of lower-class adults say it is not required (63%), while 36% say that it is. And among the 11% of the public who describe themselves as lower class – separate from the 31% who say they are lower-middle class – as many say a college degree is needed to be considered middle class (49%) as say it is not (49%).


