Most of the data in this report come from online interviews completed by 7,917 law enforcement officers from 54 police and sheriff’s departments across the United States. Of these, 6,795 interviews came from 43 municipal police departments and 1,122 interviews came from 11 county sheriff’s departments. The surveys were administered between May 19 and Aug. 14, 2016. The study was conducted by the National Police Research Platform (NPRP), a consortium of researchers and practitioners around the country headquartered at the University of Illinois at Chicago during the study period. The sample is designed and weighted to represent the population of officers who work in agencies that employ at least 100 full-time sworn law enforcement officers with general arrest powers.15
Sample design
Participating agencies belong to a panel that was created by the NPRP. Because there is no comprehensive national list of individual police officers, it is not possible to directly draw a simple random sample of officers from all departments in the United States. Instead, selection needs to take place in multiple stages. The first stage involves selecting a sample of police departments, for which there is a comprehensive list. The second stage is to sample officers within those departments, which is possible because departments have a clear accounting of the officers they employ.
The first stage selection of police departments was performed by the NPRP in 2013. The 2007 Law Enforcement Management and Administrative Statistics (LEMAS) survey was used as the sampling frame. LEMAS is a survey of municipal police departments, sheriff’s departments and state police. It is conducted periodically by the U.S. Bureau of Justice Statistics and includes all agencies in the country with 100 or more sworn officers and a sample of agencies with fewer than 100 officers.
The NPRP panel was composed of a stratified random sample of agencies authorized to employ 100 to 3,000 officers and a purposive sample of larger agencies. For agencies other than the very largest, the eligibility criteria for selection into the panel were different for municipal police departments and sheriff’s departments. Municipal police departments were deemed eligible if they were authorized to employ 100 or more full-time sworn officers and employed at least 50 officers whose regular duties include responding to citizen calls for service. Sheriff’s departments were eligible if they were authorized to employ between 100 and 3,000 full-time sworn officers whose duties do not include jail operations, court security (e.g., court bailiffs) or civil processes such as serving subpoenas, and employed 50 or more officers who respond to citizen calls for service. These criteria were intended to exclude sheriff’s departments that do not engage in traditional policing duties. State police agencies were not eligible for inclusion.
Some 757 departments met these criteria. That list was stratified by agency type (police vs. sheriff), number of law enforcement officers and Census Bureau region, and a random sample of 410 agencies was selected. Of these, 87 (21.2%) agreed to join the panel and participated in the first NPRP survey. These 87 agencies (from the randomly selected sample) were supplemented with four purposively selected larger municipal police departments that were authorized to employ over 3,000 full-time sworn officers. In 2013, these four agencies comprised roughly one-third of 11 total comparably sized municipal police departments in the U.S. and employed 38.8% of the officers in these departments.16
Within participating departments, all eligible officers were invited to participate. Officers were deemed ineligible only if their primary responsibilities consisted of court security, jail operations or civil processes.
Data collection
In order to secure participation at the agency level for the current wave of the survey (2016), the NPRP contacted the chief executives of each of the 91 previously empaneled agencies. Of these, 54 (59.3%) agreed to participate in the survey. Each agency that agreed to participate designated a liaison to coordinate with the NPRP on the data collection effort. In consultation with NPRP staff, agency liaisons and chiefs chose a starting date for the survey and developed department-specific strategies, such as pre-notification emails, fliers or roll call announcements, for encouraging officer participation.
Starting dates ranged from May 19 to July 11, 2016. On the starting date, department chiefs sent an email to all eligible officers in their departments containing a link to the survey and inviting them to participate. All eligible officers were assured that their participation was anonymous and that their individual responses would not be accessible to anyone within their department. Agencies were asked to have the chief send a follow-up email reminding officers to take the survey two weeks after the start date, and a final reminder after three weeks. Data collection was closed after approximately one month, with some agencies having shorter or longer field periods if requested by the chief or liaison.
Weighting
To ensure that estimates from this survey are generalizable to the national population of officers, the data were weighted in a two-step process. First, each officer was weighted according to his or her probability of selection. Because all officers within participating departments were sampled, each officer’s probability of selection is equal to the probability that the individual’s department was selected from within its stratum when the panel was initially created. The four large departments that were selected purposively were treated as having been selected with certainty for weighting.
Nonresponse to this survey could occur at three stages. First, agencies could have chosen not to participate in the panel when they were first sampled. Second, some agencies that did join the panel chose not to participate in this survey. Finally, within those participating agencies, not all officers responded to the survey request. A total of 91 agencies belonging to the panel were invited to participate in this survey. Of these, 54 (59.3%) agreed to participate. Across the 54 participating agencies, the total number of eligible officers is 57,062, of whom 7,917 responded, for an officer-level response rate of 13.9%.17 The response rate varied by department size, at 32.7% for agencies with fewer than 600 officers, 21.6% for agencies with 600 to 1,599 officers, and 7.9% for agencies with 1600 or more officers. To adjust for nonresponse, an iterative technique that aligns the sample to population benchmarks on a number of dimensions was applied. The data were weighted by sex, race, rank, department type, department size in 2013, the size of the population served in 2012 and U.S. Census Bureau region.
Parameters for these population characteristics come from the 2013 LEMAS survey of police departments. Several questions that were used to define the group of eligible departments in 2007 were not asked in 2013. Equivalent parameters were calculated using an alternative definition for the population of eligible departments that relied only on variables that were available in both 2007 and 2013. This revised population definition overlapped with the original definition for 97.9% of the officers in either set of departments.
Because LEMAS is a survey of departments rather than officers, officer-level estimates were produced by weighting eligible departments by the number of officers who met the eligibility criteria for this survey. For municipal police departments, this measure of size was equal to the number of full-time sworn officers in each department. For sheriff’s departments, it was equal to the number of full-time sworn officers whose primary responsibilities did not include jail operations or court security. Because the 2013 LEMAS survey did not measure the number of officers whose primary duty is civil processes, these officers could not be subtracted from the measure of size. However, their share of the population in 2007 was too small to appreciably affect weighting parameters (2.6% of officers in eligible sheriff’s departments and less than 1% of officers in all eligible departments).
Law Enforcement Organizational (LEO) surveys
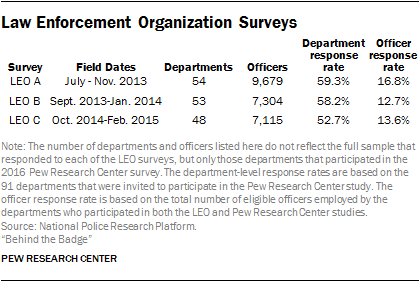
Several of the questions included in this survey were also asked on three earlier surveys conducted by the National Police Research Platform referred to as LEO A, LEO B and LEO C, respectively. The estimates in this report from these earlier LEO surveys were produced using data from only those departments that participated in both the original LEO survey and this Pew Research Center study. The original LEO survey datasets include officers who only partially completed the full survey. To ensure comparability to the Pew Research Center survey, only officers who answered one or more questions about age, sex, race or rank – which were located at the end of the survey – were used for analysis. As with the current study, analysis was also restricted to officers whose primary responsibilities did not include court security, jail operations or civil processes. The data were weighted following the procedure described above.
Precision of estimates
Because of the complex design of this survey, it is not possible to produce a single margin of sampling error that applies to all of the estimates from this survey. Some estimates (e.g., those measuring the officer’s own attitudes) have a relatively small margin of error, while other estimates (e.g., those measuring a department’s policies – which are roughly the same for everyone in the department) have a larger margin of error. Consequently, we estimated precision separately for each survey estimate. A list of the margins of sampling error for each question is available upon request.
The multistage sampling process used in this survey – first departments and then officers – means that survey responses are not independent of each other as they would be if we had taken a simple random sample of all police officers directly. This clustering of officers within departments has the effect of increasing the margin of error for survey estimates relative to a simple random sample of the same size. Additionally, this clustering means that every question has a different margin of error depending on how similar officers in the same department are to one another for the item in question.
For questions where most officers in the same department give similar answers, the margin of error is larger than for items where officers give more diverse responses. For example, question 39d asks officers if their department has modified its policies about the use of force. In principle, the answer to this question should be the same for all officers in the same department. The margin of sampling error for the percentage of officers who answered yes to this question is plus or minus 9 percentage points. For this item, each additional officer in a department contributes very little additional information to the estimate. At the other end of the scale, the margin of sampling error for the share of officers who see themselves as more of a protector than an enforcer in question 15 is plus or minus 1.5 percentage points. The sampling variability for other estimates falls somewhere in between depending on how responses are distributed within departments.
In addition to clustering, the margin of error is affected by stratified sampling and weighting. The analysis included in this report was performed using software that accounts for all of these complex design features for tests of statistical significance and measures of sampling error.
One should also bear in mind that question wording and practical difficulties in conducting surveys can introduce error or bias into survey results that is not captured by the margin of sampling error.
Survey of the general public
The American Trends Panel (ATP), created by the Pew Research Center, is a nationally representative panel of randomly selected U.S. adults living in households. Respondents who self-identify as internet users and who provided an email address participate in the panel via monthly self-administered Web surveys, and those who do not use the internet or decline to provide an email address participate via the mail. The panel is being managed by Abt SRBI.
The data representing the general public in this report are drawn from the August wave of the panel, conducted August 16-September 12, 2016 among 4,538 respondents (4,195 by Web and 343 by mail). The margin of sampling error for the full sample of 4,538 respondents is plus or minus 2.4 percentage points.
Members of the American Trends Panel were recruited from two large, national landline and cellphone random digit dial (RDD) surveys conducted in English and Spanish. At the end of each survey, respondents were invited to join the panel. The first group of panelists was recruited from the 2014 Political Polarization and Typology Survey, conducted January 23rd to March 16th, 2014. Of the 10,013 adults interviewed, 9,809 were invited to take part in the panel and a total of 5,338 agreed to participate.18 The second group of panelists was recruited from the 2015 Survey on Government, conducted August 27th to October 4th, 2015. Of the 6,004 adults interviewed, all were invited to join the panel, and 2,976 agreed to participate.19
Participating panelists provided either a mailing address or an email address to which a welcome packet, a monetary incentive and future survey invitations could be sent. Panelists also receive a small monetary incentive after participating in each wave of the survey.
The ATP data were weighted in a multi-step process that begins with a base weight incorporating the respondents’ original survey selection probability and the fact that in 2014 some panelists were subsampled for invitation to the panel. Next, an adjustment was made for the fact that the propensity to join the panel and remain an active panelist varied across different groups in the sample. The final step in the weighting uses an iterative technique that matches gender, age, education, race, Hispanic origin and region to parameters from the U.S. Census Bureau’s 2014 American Community Survey. Population density is weighted to match the 2010 U.S. Decennial Census. Telephone service is weighted to estimates of telephone coverage for 2016 that were projected from the July-December 2015 National Health Interview Survey. Volunteerism is weighted to match the 2013 Current Population Survey Volunteer Supplement. It also adjusts for party affiliation using an average of the three most recent Pew Research Center general public telephone surveys. Internet access is adjusted using a measure from the 2015 Survey on Government. Frequency of internet use is weighted to an estimate of daily internet use projected to 2016 from the 2013 Current Population Survey Computer and Internet Use Supplement. Sampling errors and statistical tests of significance take into account the effect of weighting. Interviews are conducted in both English and Spanish, but the Hispanic sample in the American Trends Panel is predominantly native born and English speaking.
The error attributable to sampling that would be expected at the 95% level of confidence for the total sample is ± 2.4 percentage points.
Sample sizes and sampling errors for subgroups are available upon request.
In addition to sampling error, one should bear in mind that question wording and practical difficulties in conducting surveys can introduce error or bias into the findings of opinion polls.
The Web component of the August wave had a response rate of 81% (4,195 responses among 5,150 Web-based individuals in the panel); the mail component had a response rate of 76% (343 responses among 454 non-Web individuals in the panel). Taking account of the combined, weighted response rate for the recruitment surveys (10.0%) and attrition from panel members who were removed at their request or for inactivity, the cumulative response rate for the August ATP wave is 2.9%.20

 Video: How police view their jobs