As intermarriage grows more prevalent in the United States, the public has become more accepting of it. A growing share of adults say that the trend toward more people of different races marrying each other is generally a good thing for American society.10 At the same time, the share saying they would oppose a close relative marrying someone of a different race has fallen dramatically.
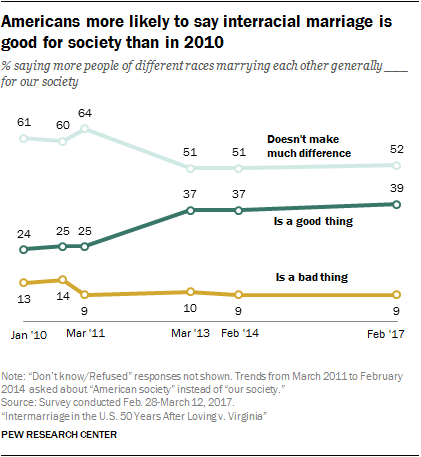
A new Pew Research Center survey finds that roughly four-in-ten adults (39%) now say that more people of different races marrying each other is good for society – up significantly from 24% in 2010. The share saying this trend is a bad thing for society is down slightly over the same period, from 13% to 9%. And the share saying it doesn’t make much of a difference for society is also down, from 61% to 52%. Most of this change occurred between 2010 and 2013; opinions have remained essentially the same since then.
Attitudes about interracial marriage vary widely by age. For example, 54% of those ages 18 to 29 say that the rising prevalence of interracial marriage is good for society, compared with about a quarter of those ages 65 and older (26%). In turn, older Americans are more likely to say that this trend doesn’t make much difference (60% of those ages 65 and older, compared with 42% of those 18 to 29) or that it is bad for society (14% vs. 5%, respectively).

Views on interracial marriage also differ by educational attainment. Americans with at least a bachelor’s degree are much more likely than those with less education to say more people of different races marrying each other is a good thing for society (54% of those with a bachelor’s degree or more vs. 39% of those with some college education and 26% of those with a high school diploma or less). Among adults with a high school diploma or less, 16% say this trend is bad for society, compared with 6% of those with some college experience and 4% of those with at least a bachelor’s degree.
Men are more likely than women to say the rising number of interracial marriages is good for society (43% vs. 34%) while women are somewhat more likely to say it’s a bad thing (12% vs. 7%). This is a change from 2010, when men and women had almost identical views. Then, about a quarter of each group (23% of men and 24% of women) said this was a good thing and 14% and 12%, respectively, said it was a bad thing.
Blacks (18%) are more likely than whites (9%) and Hispanics (3%) to say more people of different races marrying each other is generally a bad thing for society, though there are no significance differences by race or ethnicity on whether it is a good thing for society.11
Among Americans who live in urban areas, 45% say this trend is a good thing for society, as do 38% of those in the suburbs; lower shares among those living in rural areas share this view (24%). In turn, rural Americans are more likely than those in urban or suburban areas to say interracial marriage doesn’t make much difference for society (63% vs. 49% and 51%, respectively).
The view that the rise in the number of interracial marriages is good for society is particularly prevalent among Democrats and Democratic-leaning independents; 49% in this group say this, compared with 28% of Republicans and those who lean Republican. The majority of Republicans (60%) say it doesn’t make much of a difference, while 12% say this trend is bad for society. Among Democrats, 45% say it doesn’t make much difference while 6% say it’s bad thing. This difference persists when controlling for race. Among whites, Democrats are still much more likely than Republicans to say more interracial marriages are a good thing for society.

Americans are now much more open to the idea of a close relative marrying someone of a different race
Just as views about the impact of interracial marriage on society have evolved, Americans’ attitudes about what is acceptable within their own family have changed. A new Pew Research Center analysis of General Social Survey (GSS) data finds that the share of U.S. adults saying they would be opposed to a close relative marrying someone of a different race or ethnicity has fallen since 2000.
In 2000, 31% of Americans said they would oppose an intermarriage in their family.12 That share dropped to 9% in 2002 but climbed again to 16% in 2008. It has fallen steadily since, and now one-in-ten Americans say they would oppose a close relative marrying someone of a different race or ethnicity.

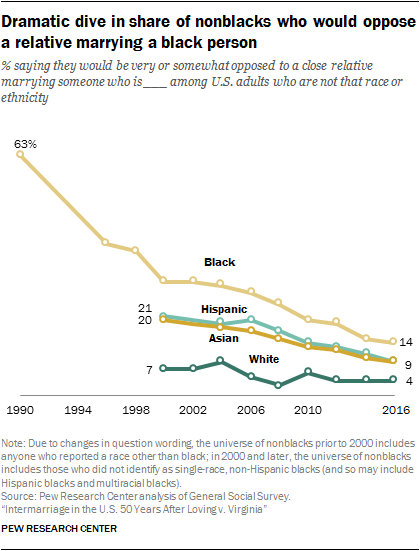
These modest changes over time belie much larger shifts when it comes to attitudes toward marrying people of specific races. As recently as 1990, roughly six-in-ten nonblack Americans (63%) said they would be opposed to a close relative marrying a black person. This share had been cut about in half by 2000 (at 30%), and halved again since then to stand at 14% today.13
In 2000, one-in-five non-Asian adults said they would be opposed to a close relative marrying an Asian person, and a similar share of non-Hispanic adults (21%) said the same about a family member marrying a Hispanic person. These shares have dropped to around one-in-ten for each group in 2016.
Among nonwhite adults, the share saying they would be opposed to a relative marrying a white person stood at 4% in 2016, down marginally from 7% in 2000 when the GSS first included this item.
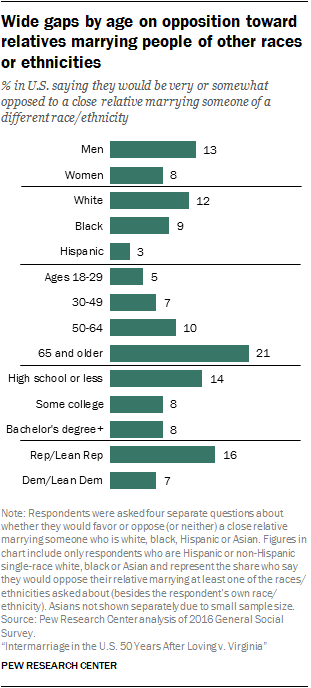
While these views have changed substantially over time, significant demographic gaps persist. Older adults are especially likely to oppose having a family member marry someone of a different race or ethnicity. Among those ages 65 and older, about one-in-five (21%) say they would be very or somewhat opposed to an intermarriage in their family, compared with one-in-ten of those ages 50 to 64, 7% of those 30 to 49 and only 5% of those 18 to 29.
Whites (12%) and blacks (9%) are more likely than Hispanics (3%) to say they would oppose a close relative marrying someone of a different race or ethnicity. Men are somewhat more likely than women to say this as well (13% vs. 8%).
Americans with less education are more likely to oppose an intermarriage in their family: 14% of adults with a high school diploma or less education say this, compared with 8% of those with some college education and those with a bachelor’s degree, each.
There are also large differences by political party, with Republicans and those who lean toward the Republican Party roughly twice as likely as Democrats and Democratic leaners to say they would oppose a close relative marrying someone of a different race (16% vs. 7%). Controlling for race, the gap is the same: Among whites, 17% of Republicans and 8% of Democrats say they would oppose an intermarriage in their family.


