The term “intermarriage” refers to marriages between a Hispanic and a non-Hispanic, or marriages between non-Hispanic spouses who come from the following different racial groups: white, black, Asian, American Indian, multiracial or some other race.1
In the racial and ethnic classification system used for this report, individuals are classified first by ethnicity (defined as whether someone is Hispanic or not) and then by race. As such, all references to whites, blacks, Asians, American Indians, multiracial persons or persons of some other race include those who are not Hispanic; Hispanics may be of any race. So, for instance, in the 2015 American Community Survey, 4% of black newlyweds reported that they are also Hispanic. These people are categorized as “Hispanic” in this analysis, and if they are married to someone who identifies as a non-Hispanic black, both are counted as being in an intermarriage. By the same token, if a Hispanic black person marries a non-Hispanic white person, their marriage would be classified as one between a Hispanic and a white person rather than a black and a white person.
Beginning with the 2000 census, individuals could choose to identify with more than one group in response to the race question. In this analysis, these multiracial people are treated as a separate race category, different from those who identify as a single race, including those who identify as “some other race.” (As with single race individuals, a multiracial person who also identifies as Hispanic would be classified as Hispanic.)
In the secondary data analysis, the term “Asian” includes native Hawaiians and other Pacific Islanders; “American Indian” includes Alaska natives. In the analysis of the Pew Research Center surveys and the General Social Survey, Asian includes anyone who self-identifies as Asian.
“Newlyweds” or people who are “recently married” or “newly married” include those who got married in the 12 months prior to being surveyed for 2008 to 2015 data. In all other years, newlyweds are those who married in that same year. Data analyses for 1967 through 1980 are limited to newlyweds who married for the first time, while analyses for subsequent years include people marrying for the first time and those who have remarried.
People born in one of the 50 states or the District of Columbia or who were born abroad to at least one American parent are classified as “U.S. born.” All others are classified as “foreign born,” including those born in Puerto Rico or other United States territories. While these individuals are U.S. citizens by birth, the convention of categorizing persons living in the U.S. who were born in U.S. territories as foreign born has been used by the United Nations. The terms “foreign born” and “immigrant” are used interchangeably.
In the analysis of educational attainment, “some college” includes those with an associate degree or those who attended college but did not obtain a degree. “High school or less” includes those who have attained a high school diploma or its equivalent, such as a General Education Development (GED) certificate.
“Metro areas” in this report are classified based on metropolitan statistical areas (MSA), which consist of at least one large urban core with 50,000 people or more, as well as neighboring areas that are socially and economically linked to the core area. They are a proxy for urban and suburban areas.
For Pew Research Center survey data, references to urban, suburban and rural are based on the respondent’s ZIP code. Urban residents are those who live within the central city of an MSA. Suburban residents are those who live within an MSA county, but are not within the central city. Rural residents are those who do not live in an MSA county.
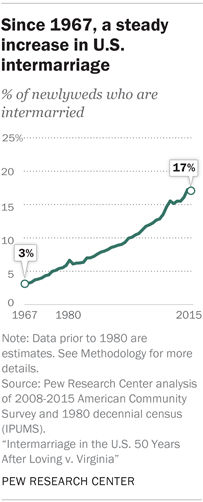
In 2015, 17% of all U.S. newlyweds had a spouse of a different race or ethnicity, marking more than a fivefold increase since 1967, when 3% of newlyweds were intermarried, according to a new Pew Research Center analysis of U.S. Census Bureau data.2 In that year, the U.S. Supreme Court in the Loving v. Virginia case ruled that marriage across racial lines was legal throughout the country. Until this ruling, interracial marriages were forbidden in many states.
More broadly, one-in-ten married people in 2015 – not just those who recently married – had a spouse of a different race or ethnicity. This translates into 11 million people who were intermarried. The growth in intermarriage has coincided with shifting societal norms as Americans have become more accepting of marriages involving spouses of different races and ethnicities, even within their own families.
The most dramatic increases in intermarriage have occurred among black newlyweds. Since 1980, the share who married someone of a different race or ethnicity has more than tripled from 5% to 18%. White newlyweds, too, have experienced a rapid increase in intermarriage, with rates rising from 4% to 11%. However, despite this increase, they remain the least likely of all major racial or ethnic groups to marry someone of a different race or ethnicity.
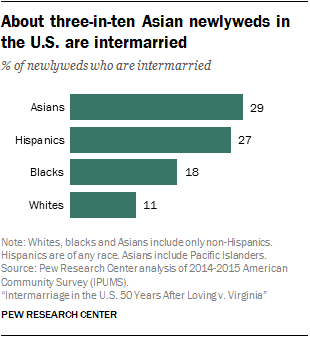
Asian and Hispanic newlyweds are by far the most likely to intermarry in the U.S. About three-in-ten Asian newlyweds3 (29%) did so in 2015, and the share was 27% among recently married Hispanics. For these groups, intermarriage is even more prevalent among the U.S. born: 39% of U.S.-born Hispanic newlyweds and almost half (46%) of U.S.-born Asian newlyweds have a spouse of a different race or ethnicity.
For blacks and Asians, stark gender differences in intermarriage
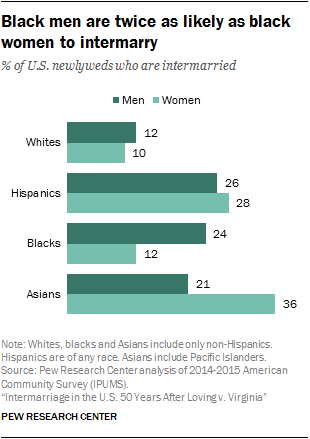
Among blacks, intermarriage is twice as prevalent for male newlyweds as it is for their female counterparts. While about one-fourth of recently married black men (24%) have a spouse of a different race or ethnicity, this share is 12% among recently married black women.
There are dramatic gender differences among Asian newlyweds as well, though they run in the opposite direction – Asian women are far more likely to intermarry than their male counterparts. In 2015, just over one-third (36%) of newlywed Asian women had a spouse of a different race or ethnicity, compared with 21% of newlywed Asian men.
In contrast, among white and Hispanic newlyweds, the shares who intermarry are similar for men and women. Some 12% of recently married white men and 10% of white women have a spouse of a different race or ethnicity, and among Hispanics, 26% of newly married men and 28% of women do.
A more diverse population and shifting attitudes are contributing to the rise of intermarriage
The rapid increases in intermarriage rates for recently married whites and blacks have played an important role in driving up the overall rate of intermarriage in the U.S. However, the growing share of the population that is Asian or Hispanic, combined with these groups’ high rates of intermarriage, is further boosting U.S. intermarriage overall. Among all newlyweds, the share who are Hispanic has risen by 9 percentage points since 1980, and the share who are Asian has risen 4 points. Meanwhile, the share of newlyweds who are white has dropped by 15 points.
Attitudes about intermarriage are changing as well. In just seven years, the share of adults saying that the growing number of people marrying someone of a different race is good for society has risen 15 points, to 39%, according to a new Pew Research Center survey conducted Feb. 28-March 12, 2017.
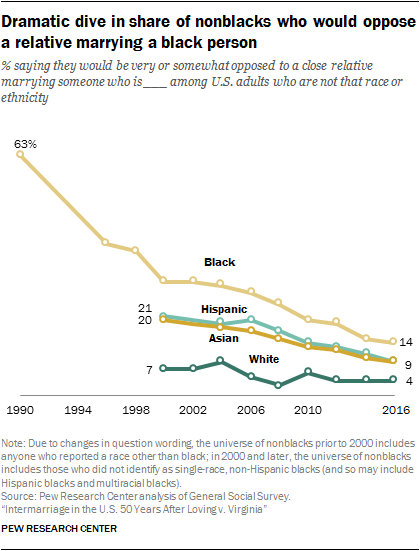
The decline in opposition to intermarriage in the longer term has been even more dramatic, a new Pew Research Center analysis of data from the General Social Survey has found. In 1990, 63% of nonblack adults surveyed said they would be very or somewhat opposed to a close relative marrying a black person; today the figure stands at 14%. Opposition to a close relative entering into an intermarriage with a spouse who is Hispanic or Asian has also declined markedly since 2000, when data regarding those groups first became available. The share of nonwhites saying they would oppose having a family member marry a white person has edged downward as well.
Intermarriage somewhat more common among the college educated
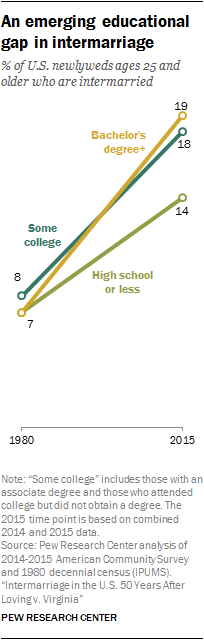
In 1980, the rate of intermarriage did not differ markedly by educational attainment among newlyweds. Since that time, however, a modest intermarriage gap has emerged. In 2015, 14% of newlyweds with a high school diploma or less were married to someone of a different race or ethnicity, compared with 18% of those with some college and 19% of those with a bachelor’s degree or more.
The educational gap is most striking among Hispanics: While almost half (46%) of Hispanic newlyweds with a bachelor’s degree were intermarried in 2015, this share drops to 16% for those with a high school diploma or less – a pattern driven partially, but not entirely, by the higher share of immigrants among the less educated. Intermarriage is also slightly more common among black newlyweds with a bachelor’s degree (21%) than those with some college (17%) or a high school diploma or less (15%).
Among recently married Asians, however, the pattern is different – intermarriage is far more common among those with some college (39%) than those with either more education (29%) or less education (26%). Among white newlyweds, intermarriage rates are similar regardless of educational attainment.
Other key findings
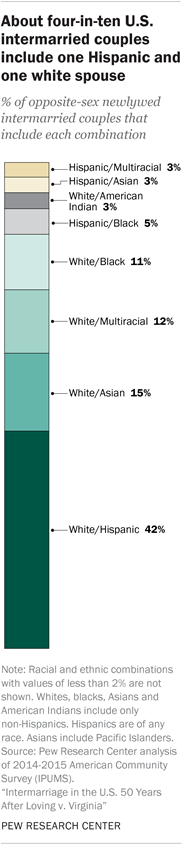
- The most common racial or ethnic pairing among newlywed intermarried couples is one Hispanic and one white spouse (42%). Next most common are one white and one Asian spouse (15%) and one white and one multiracial spouse (12%).
- Newlyweds living in metropolitan areas are more likely to be intermarried than those in non-metropolitan areas (18% vs. 11%). This pattern is driven entirely by whites; Hispanics and Asians are more likely to intermarry if they live in non-metro areas. The rates do not vary by place of residence for blacks.
- Among black newlyweds, the gender gap in intermarriage increases with education: For those with a high school diploma or less, 17% of men vs. 10% of women are intermarried, while among those with a bachelor’s degree, black men are more than twice as likely as black women to intermarry (30% vs. 13%).
- Among newlyweds, intermarriage is most common for those in their 30s (18%). Even so, 13% of newlyweds ages 50 and older are married to someone of a different race or ethnicity.
- There is a sharp partisan divide in attitudes about interracial marriage. Roughly half (49%) of Democrats and independents who lean to the Democratic Party say the growing number of people of different races marrying each other is a good thing for society. Only 28% of Republicans and Republican-leaning independents share that view.


