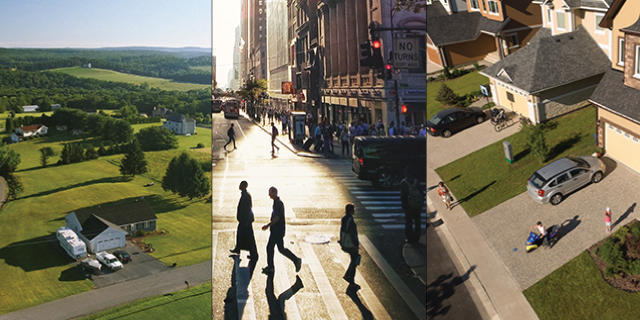
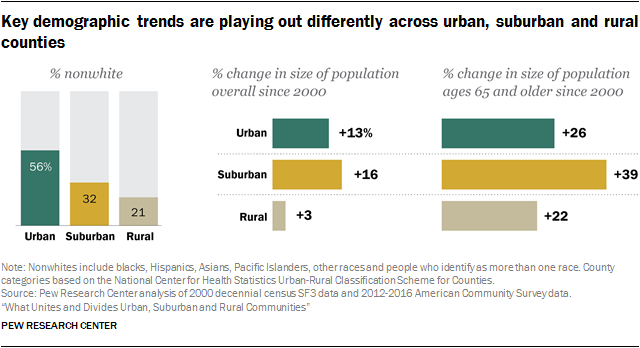
Large demographic shifts are reshaping America. The country is growing in numbers, it’s becoming more racially and ethnically diverse and the population is aging. But according to a new analysis by Pew Research Center, these trends are playing out differently across community types.
Urban areas are at the leading edge of racial and ethnic change, with nonwhites now a clear majority of the population in urban counties while solid majorities in suburban and rural areas are white. Urban and suburban counties are gaining population due to an influx of immigrants in both types of counties, as well as domestic migration into suburban areas. In contrast, rural counties have made only minimal gains since 2000 as the number of people leaving for urban or suburban areas has outpaced the number moving in. And while the population is graying in all three types of communities, this is happening more rapidly in the suburbs than in urban and rural counties.
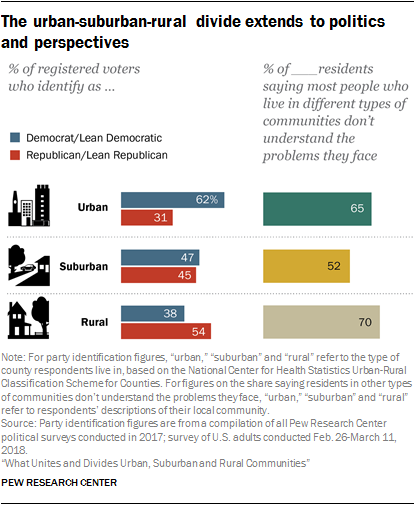
At the same time, urban and rural communities are becoming increasingly different from each other politically. Adults in urban counties, long aligned with the Democratic Party, have moved even more to the left in recent years, and today twice as many urban voters identify as Democrats or lean Democratic as affiliate with the Republican Party. For their part, rural adults have moved more firmly into the Republican camp. More than half (54%) of rural voters now identify with or lean to the GOP, while 38% are Democrats or lean Democratic.
Against this backdrop, a new Pew Research Center survey finds that many urban and rural residents feel misunderstood and looked down on by Americans living in other types of communities. About two-thirds or more in urban and rural areas say people in other types of communities don’t understand the problems people face in their communities. And majorities of urban and rural residents say people who don’t live in their type of community have a negative view of those who do. In contrast, most suburbanites say people who don’t live in the suburbs have a positive view of those who do.
In exploring the attitudes, experiences and changing demographics of Americans in different types of communities, this report relies on two distinct approaches to defining urban, suburban and rural areas. For the analysis of findings from the new Pew Research Center survey (Chapters 2-7 of the report), references to urban, suburban and rural communities are based on respondents’ answer to the following question: “How would you describe the community where you currently live? (1) urban, (2) suburban, (3) rural.”
The analysis of how urban, suburban and rural communities are changing along demographic lines (Chapter 1), based on U.S. Census Bureau data, relies on county-level classifications created by the National Center for Health Statistics at the Centers for Disease Control and Prevention.
In determining how to draw the lines between “urban,” “suburban” and “rural” communities, Pew Research Center consulted a series of social scientists with expertise in this area. To be sure, there are many ways – and no one right way – to classify communities. Because the survey explored issues related to how Americans are experiencing life in their local communities, including how they relate to their neighbors and how attached they feel to their communities, we settled on a definition based on people’s description of the area where they live.
The classification based on counties used in the analysis of census data makes it more challenging to speak to the specific localities where Americans live, but it has the advantage of allowing for the data to be more easily linked among government data sources to analyze changes over time across the country.
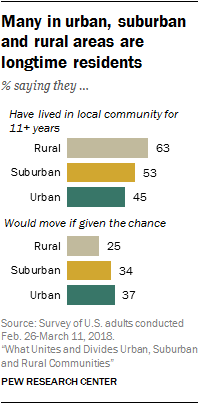
The divides that exist across urban, suburban and rural areas when it comes to views on social and political issues don’t necessarily extend to how people are experiencing life in different types of communities. Rural and suburban adults are somewhat more rooted in their local areas, but substantial shares in cities, suburbs and rural areas say they have lived in their communities for more than 10 years. And about six-in-ten in each type of community say they feel at least some sense of attachment to their communities, though relatively few say they are very attached.
For adults who currently live in or near the place where they grew up – roughly half in rural areas and about four-in-ten in cities and suburbs – family ties stand out as the most important reason why they have never left or why they moved back after living away. And, when it comes to their interactions with neighbors, urban, suburban and rural residents are about equally likely to say they communicate with them on a regular basis.
In addition, urban and rural residents share some of the same concerns. Roughly equal shares of urban (50%) and rural (46%) residents say that drug addiction is a major problem in their local community. When it comes to the availability of jobs, rural adults are somewhat more likely to say this is a major problem where they live (42% say so), but a substantial share of urban dwellers (34%) say the same, significantly higher than the share in suburban communities (22%). Other problems – such as access to affordable housing in cities and access to public transportation in rural areas – are felt more acutely in some areas than in others.
The nationally representative survey of 6,251 adults was conducted online Feb. 26-March 11, 2018, using Pew Research Center’s American Trends Panel.1 It explores the attitudes and experiences of Americans in urban, suburban and rural areas, including their views on key social and political issues, how they see people in other types of communities, and how they’re living out their lives in their local communities. The survey sheds light on what divides and unites Americans across community types as well as on differences within urban, suburban and rural areas – sometimes driven by partisanship, sometimes by demographics. The study also includes a detailed analysis of demographic trends in urban, rural and suburban counties. Among the report’s key findings:
There are significant gaps in measures of economic well-being in urban, suburban and rural counties
In addition to the divergent demographic trends taking place in urban, suburban and rural communities, the analysis finds that rural counties lag behind their urban and suburban counterparts when it comes to some measures related to economic well-being. The average earnings per worker in urban areas were $49,515 in 2016, followed by $46,081 in the suburbs and $35,171 in rural areas, though these figures don’t account for differences in living costs across county types. And while the number of employed adults ages 25 to 54 rose in urban and suburban counties since 2000, it declined in rural counties overall.
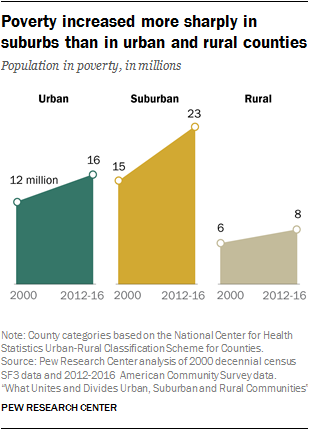
When it comes to the number of people living in poverty, however, the suburbs have seen much sharper increases since 2000 than urban or rural counties – a 51% increase, compared with 31% in cities and 23% in rural areas. Overall, the poverty rate is somewhat higher in rural (18%) and urban (17%) areas than in suburban (14%) counties.
Rural Americans, especially those without a college degree, are less optimistic about their financial future
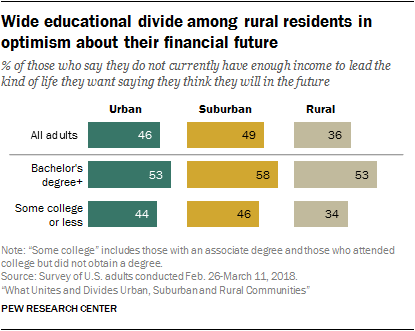
Majorities of Americans in urban (68%), suburban (59%) and rural (62%) communities say they don’t currently have enough income to lead the kind of life they want. But while about half of those in cities (46%) and suburbs (49%) who say this is the case believe they will have enough income in the future, rural residents are less optimistic: 63% of adults in rural areas who say they don’t currently have enough income to lead the kind of life they want don’t expect to in the future, while 36% think they eventually will.
The gap in financial optimism across community types is driven by a marked concern among rural residents without a bachelor’s degree. In rural areas, about a third (34%) of those with some college or less education who say they don’t currently have enough income to lead the kind of life they want think they will in the future; higher shares in cities (44%) and suburbs (46%) say this is the case. In contrast, similar shares of those with a bachelor’s degree or more education in urban (53%), suburban (58%) and rural (53%) areas think they will eventually have enough income to lead the kind of life they want.
Across community types, majorities say rural areas get less than their fair share of federal dollars
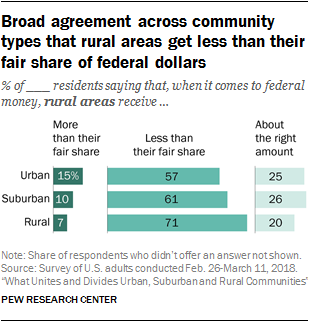
About seven-in-ten rural residents (71%), and somewhat narrower majorities in suburban (61%) and urban (57%) communities, say rural areas receive less than their fair share of federal dollars. These views don’t vary considerably across demographic or partisan lines.
When it comes to the amount urban areas receive from the federal government, about half of urban dwellers (49%) say cities receive less than their fair share; only about a third of those in suburbs and rural areas share this view. Across community types, Democrats are more likely than Republicans to say urban areas receive less than their fair share, while Republicans are more likely to say these types of communities receive more than their fair share. Similar shares of Democrats and Republicans within each community type say urban areas receive about the right amount of federal dollars.
About six-in-ten rural residents say the values of urban dwellers don’t align with theirs; 53% of urban residents say the same about the values of those in rural areas
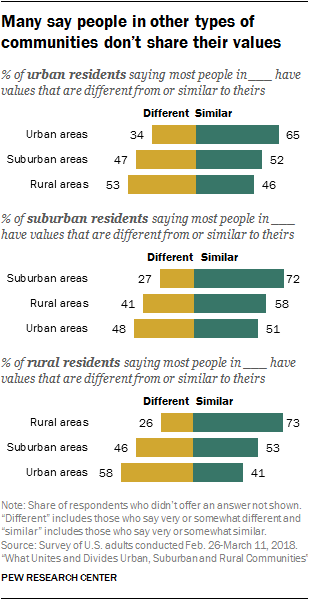
Most Americans say people who live in the same type of community as they do generally share their values, but they are less convinced that those in other types of communities do. For example, a majority of rural residents (58%) say the values of most people in urban areas are very or somewhat different from theirs.
Among urban dwellers, 53% see an urban-rural divide on values, while 46% say most people in rural areas have values that are similar to their own. About half in urban and rural areas say most people in suburbs share their values, while suburbanites are somewhat more likely to say most people in rural areas have values that are similar to their own (58%) than to say the same about those in urban areas (51%).
There’s a clear political dimension to these attitudes. For example, majorities of Republicans in urban (64%) and suburban (78%) communities say most people in rural areas share their values, while about six-in-ten Democrats in these communities say the values of most rural residents are different from theirs.
Conversely, Democrats in suburban and rural areas are far more likely than their Republican counterparts to say most people who live in cities share their values. Even among Republicans who live in urban areas, only about half (48%) say most people who live in cities share their values.
Urban and rural Americans differ sharply in their views of some key social and political issues, but in some cases this has more to do with partisanship than geography
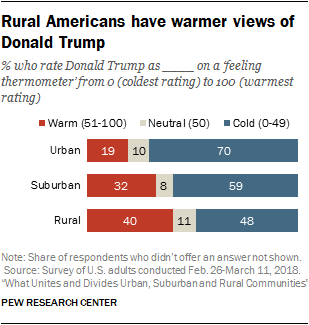
Americans in urban and rural communities have widely different views when it comes to social and political issues, including their assessments of President Donald Trump and opinions about race, immigration, same-sex marriage, abortion and the role of government.
In many cases, the differences between urban and rural residents can be attributed to the fact that rural areas tend to have a higher concentration of Republicans and Republican-leaning independents, while majorities in urban communities identify with or lean toward the Democratic Party. For example, while urban dwellers are far more likely than their rural counterparts to say abortion should be legal in all or most cases, that the government should do more to solve problems, and that whites benefit from advantages in society that black people do not have, these differences shrink when partisanship is taken into account. In other words, Democrats across community types share similar views on these issues, as do Republicans in urban, rural and suburban areas.
On other issues, differences across community types remain, even after controlling for partisanship. Rural Republicans are more likely than Republicans in urban areas to say the legalization of same-sex marriage is a bad thing for society, and they are also more likely to express very positive views of Trump. In turn, Democrats across community types express different views on immigration, with those in urban areas more likely than their rural counterparts to say the growing number of newcomers strengthens American society.
Seven-in-ten urban dwellers – vs. about half in rural areas – say it’s important to them to live in a community that is racially and ethnically diverse
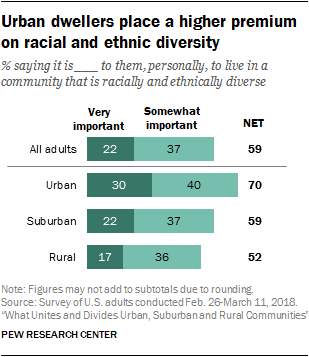
Rural residents are far more likely than their suburban and urban counterparts to say that, as far as they know, all or most of their neighbors are the same race or ethnicity as they are (69% vs. 53% and 43%, respectively). And urban residents place a much higher priority on living in a community that is racially and ethnically diverse than do those in suburban and rural areas: 70% of city dwellers say this is very or somewhat important to them, compared with a narrower majority of those in suburbs (59%) and about half in rural areas (52%).
Across community types, relatively few say all or most of their neighbors share their political views: About a quarter in urban (25%) and rural (24%) communities and 19% in the suburbs say this is the case. Perhaps not surprisingly, given the political makeup of urban and rural communities, majorities of Republicans in cities (59%) and Democrats in rural areas (57%) say only some or none of their neighbors share their political views.
Living among politically like-minded people is not a top priority for most Americans: Only one-in-ten or fewer in urban (10%), suburban (8%) and rural (6%) communities say it is very important to them personally to live in a community where most people share their political views. Still, many say this is at least somewhat important to them (46%, 43% and 38%, respectively).
Urban and rural residents see drug addiction as a top-tier problem in their local community
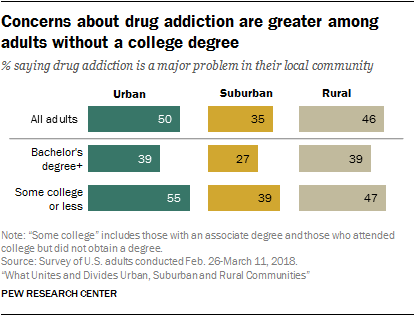
About half of urban (50%) and rural (46%) adults say drug addiction is a major problem where they live; a smaller but substantial share in the suburbs (35%) say the same about their local community.
Concerns about drug addiction vary significantly along socio-economic lines. Across community types, those without a bachelor’s degree are more likely than those with more education to say drug addiction is a major problem in their local community.
Certain problems are felt more deeply in some types of communities than in others. For example, rural adults are more likely than their urban and suburban counterparts to say access to public transportation and to high-speed internet are major problems. For their part, urban dwellers express greater concern than those in suburban and rural areas about the availability of affordable housing, crime, poverty and the quality of K-12 education in public schools.
About four-in-ten U.S. adults live in or near the community where they grew up
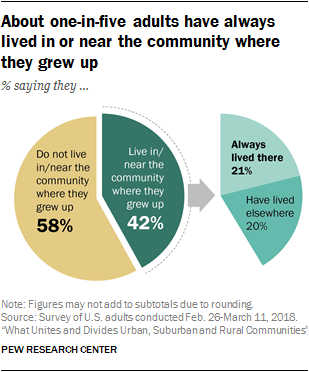
About half of rural residents (47%) say they live in or near the community where they grew up, including about a quarter (26%) who say they have always lived there. Among those in urban and suburban areas, about four-in-ten say they currently live in or near the community where they grew up (42% and 38%, respectively), with about one-in-five in each saying that has always been the case.
In urban, suburban and rural areas, more point to family ties than to any other factor as one of the main reasons why they stayed in the community where they grew up or why they left and later returned. About four-in-ten of those who left and came back (42%) and 35% of those who have lived in or near the same community their entire lives say they have done so to be near family. For both groups, factors related to the quality of life in the community, such as the cost of living, the climate, amenities, schools, or the sense of community, are the second most-cited reasons; 22% of those who left and returned and 17% of those who never left point to these factors.
About half of adults who have always lived in or near the community where they grew up (52%) say all or most of their extended family members live within an hour’s drive from them, compared with 38% of those who moved away and returned, and even smaller shares of those who don’t live in or near the community where they grew up (17%).
Across community types, relatively few say they feel very attached to the community where they live
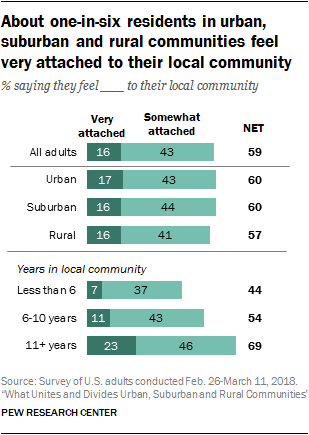
A majority of Americans (59%) say they feel some attachment to their local community, but only 16% say they feel very attached; 41% say they are not too or not at all attached to the community where they live. Adults in urban, suburban and rural areas report nearly identical levels of attachment to their local community.
In each of the three types of communities, those who have lived in their community for more than a decade and who have made connections with their neighbors are the most likely to feel a sense of attachment. About seven-in-ten adults who have lived in their community more than a decade (69%) say they feel very or somewhat attached to their local community, compared with 54% of those who have lived in their community six to 10 years and 44% of those who have done so less than six years. And while 77% of those who say they know all or most of their neighbors say they feel attached to their local community, a narrower majority of those who know some of their neighbors (55%) and about a third of those who don’t know any of their neighbors (32%) say the same.
Smaller shares of adults in rural areas than in cities and suburbs say they’d like to move away
About a third of U.S. adults (32%) say they would want to move to a different community if they could, while 37% say they would not want to move and 31% aren’t sure. One-in-four rural residents say they would move if given the chance, compared with 37% of those in urban areas and 34% of suburbanites. Among adults younger than 30, however, about an equal share in urban (42%) and rural (39%) areas say they would move if they could; 48% of young adults in the suburbs say the same.
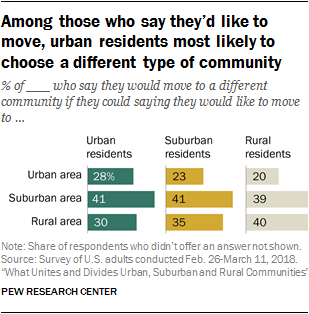
Among those who say they would want to move, many, particularly in suburban and rural areas, say they would like to stay in the same type of community. For example, about four-in-ten adults in the suburbs who would like to move (41%) say they would choose to move to another suburban community. Similarly, 40% of those in rural areas who report they would like to move say they would move to another rural community.
Among urban dwellers who say they would like to move, similar shares say they would like to stay in an urban area (28%) as say they would like to move to a rural community (30%). About four-in-ten (41%) would like to move to the suburbs.
Rural residents are more likely than those in cities or suburbs to say they know all or most of their neighbors, but no more likely to interact with them
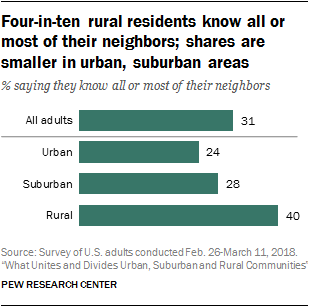
Four-in-ten adults in rural communities say they know all or most of their neighbors, compared with 28% in the suburbs and 24% in urban areas. However, among those who know at least some of their neighbors, rural Americans are no more likely than their urban and suburban counterparts to say they interact with them on a regular basis.
About half of adults who know at least some of their neighbors in urban (53%), suburban (49%) and rural (47%) communities say they have face-to-face conversations with a neighbor at least once a week. Other forms of communication, such as exchanging emails or text messages or talking on the phone with neighbors, are less common: About one-in-five or fewer in urban, rural and suburban areas say this happens at least once a week.
Americans are generally trusting of their neighbors, but those in suburban and rural areas are more so. For example, about six-in-ten of those in the suburbs (62%) and in rural communities (61%) say they have a neighbor they would trust with a set of keys to their home, compared with about half (48%) in urban areas.
There is little variation among those living in different types of communities in the share reporting they have social support, feel optimistic about their lives or feel lonely. And the idea that life in the city feels more hectic than life in the country is not borne out by the data – only about one-in-ten urban, suburban and rural residents say they always or almost always feel they are too busy to enjoy their lives.
For the analysis of findings from the new Pew Research Center survey (Chapters 2-7 of the report), references to “urban,” “suburban” and “rural” are based on respondents’ answer to the following question: “How would you describe the community where you currently live? (1) urban, (2) suburban, (3) rural.”
The analysis of how urban, suburban and rural communities are changing along demographic lines (Chapter 1), based on data from the U.S. Census Bureau, relies on county-level classifications created by the National Center for Health Statistics at the Centers for Disease Control and Prevention.
Throughout the report, the terms “urban” and “city” are used interchangeably.
All references to party affiliation include those who lean toward that party: Republicans include those who identify as Republicans and independents who say they lean toward the Republican Party, and Democrats include those who identify as Democrats and independents who say they lean toward the Democratic Party.
References to Millennials include adults who are ages 22 to 37 in 2018. Generation Xers include those who are ages 38 to 53, Baby Boomers include those who are 54 to 72 and members of the Silent Generation include those ages 73 to 90.
References to college graduates or people with a college degree comprise those with a bachelor’s degree or more. “Some college” includes those with an associate degree and those who attended college but did not obtain a degree. “High school” refers to those who have a high school diploma or its equivalent, such as a General Education Development (GED) certificate.
References to whites, blacks and Asians include only those who are non-Hispanic and identify as only one race. Hispanics are of any race. Nonwhites include blacks, Hispanics, other races and people who identify with more than one race.
“Upper class” refers to those who said they belong in the upper or upper-middle classes. “Lower class” refers to those who said they belong in the lower or lower-middle classes.


