One year after history-making political change swept the country, Indians’ fervor for their leader Narendra Modi has not abated. A new poll in India shows the public’s views of the country’s direction and the economy are on the rise.
Even so, Indians continue to see problems in their daily lives and in foreign relations. Nevertheless, in advance of Modi’s visit to the United States later this month, Indians are confident in relations between the two countries. Here are some of the key findings from a new Pew Research Center report:
Indians are overwhelmingly more positive about their country than they were two years ago. More than half (56%) of Indians express satisfaction with their country’s direction – up 27 percentage points from 2013. And nearly three-quarters say the current state of the economy is good, whereas only 57% said so two years ago.

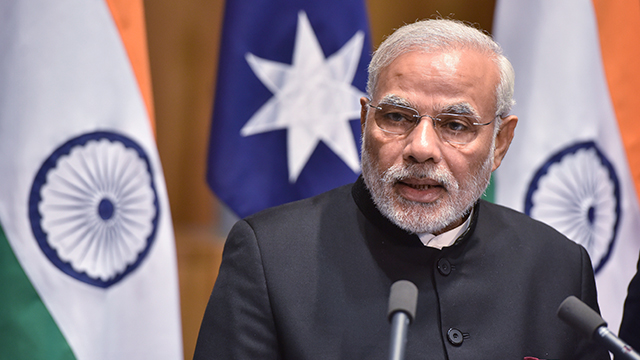
Indians’ love for Modi runs across the country. Fully 87% of Indians have a favorable view of Modi, including a strong majority (68%) who see the prime minister very favorably. And among all respondents – men and women, the young and old, the urban and rural populations and members of the three national political parties – a majority holds very favorable views of the prime minister. One exception is supporters of the main opposition party, the Indian National Congress.
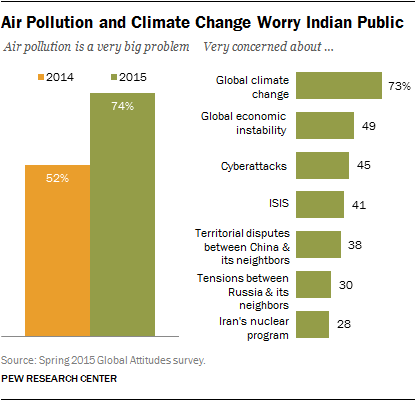
Environmental issues are a growing concern. Indians express increasing concern about air pollution. Across seven national challenges, roughly three-in-four Indians say air pollution is a very big problem compared with about only half who voiced that view in 2014 – a rise of 22 percentage points. Coal, a major pollutant, accounts for approximately 71% of India’s electricity production, according to most recent statistics from the World Bank.
Furthermore, among seven global issues, Indians are most concerned about climate change. Over seven-in-ten Indians (73%) are very concerned about global climate change, compared with 49% who are concerned with global economic instability, the second-highest response.
Indians give a thumbs-up to the national government and the military. The public’s support for the central government (93%) parallels its high support for Modi and his party, the Bharatiya Janata Party (both 87%). Since 2014, the government saw a 30 percentage point increase in those who say its influence is very good. And fully 95% say the military’s influence is good – with nearly three-quarters saying it is very good.
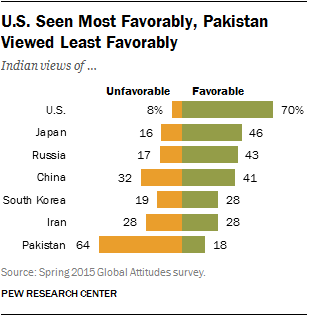
Indians have high opinions of the U.S. and President Obama. Later this month, U.S. President Barack Obama and Indian Prime Minister Modi will meet in New York to discuss, among other issues, climate change – a top concern for Indians. Meanwhile, 70% of Indians hold a favorable view of the U.S., and ratings of Obama, who visited India in January 2015, are even higher, with nearly three-quarters of the public expressing confidence in him to do the right thing regarding world affairs.