Since 1970, the middle income tier in America has shrunk by about 5 percentage points.
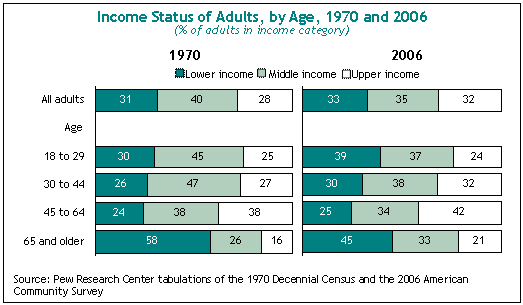
In 1970, 40% of all adults in this country lived in a middle income household, with “middle” defined as one where the income falls within 75% to 150% of the median. By 2006, just 35% of adults were in the middle income tier.

This small but notable hollowing out of the middle has been accompanied by an increase in the share of adults in both the lower income category and the upper income category. The rise in share has been greater over this time period for the upper group (to 32% in 2006 from 28% in 1970) than for the lower income tier (to 33% in 2006 from 31% in 1970). Looking at these changes by age group shows that the trends have been very different for the youngest and oldest adults. The 65 and older group has moved ahead during the past 36 years; the 18-to-29 year old group has fallen behind. Among the older group, just 45% were in the lower income tier in 2006, down from 58% in 1970. Among the younger group, 39% were lower income in 2006, up from 30% in 1970.
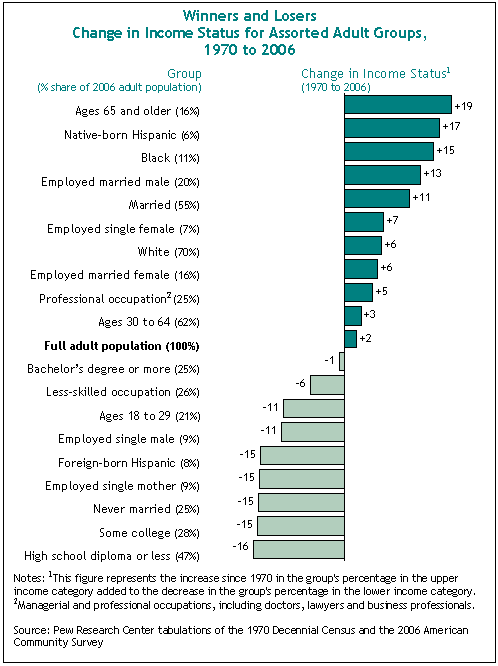
Some demographic groups have improved their income status since 1970; others have fallen behind.
The period since 1970 has seen a distinct sorting of many different demographic groups into different income tiers. In addition to the elderly, the groups that have gained the most include blacks and native-born Hispanics. Married adults have also done well, while the never-married have fallen behind.

On the gender front, men and women have moved in different directions, depending on marital and work status. Working husbands and working wives both have seen their income positions improve since 1970, but the gains have been greater for working husbands. Among those who are not married, the gender pattern is reversed: single working women’s income position has improved since 1970, while single working men’s income position has declined. Other groups that have not fared well are young adults, people in lower-skilled jobs, people with less educational attainment, and immigrant Hispanics. The decline for this last group is mainly the result of a heavy influx of low-skilled immigrants, rather than downward mobility among immigrants already in the U.S.

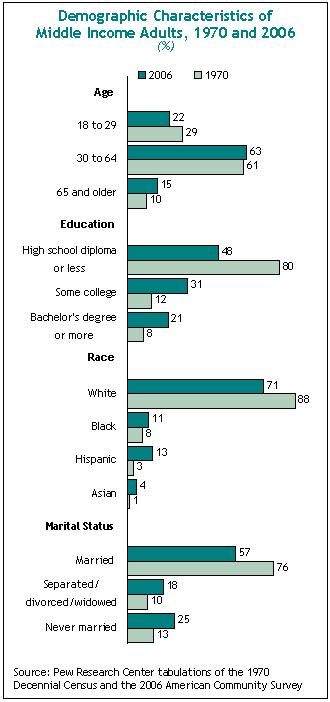
Since 1970, the middle income tier has gotten older, better educated, less likely to be white and less likely to be married.
Demographic changes in the middle income tier since 1970 are very similar to the changes in the U.S. adult population as a whole. The average age for middle income adults was 45 in 2006, up from 41 in 1970 (comparable figures for the full adult population are 46 in 2006 and 44 in 1970). In 1970, 88% of the middle income group was white; by 2006, just 71% was white (comparable figures for the full adult population are 86% in 1970 and 70% in 2006). The ethnic group that moved heavily into the middle income tier during this period was Hispanics: in 1970, they made up just 3% of the middle tier; by 2006, they were 13%.
In 1970, more than three-quarters (76%) of the middle income group were married; by 2006, just 57% were married. But the biggest demographic change has come in levels of educational attainment. In 1970, just one-in-five middle income adults had at least some college education; by 2006, more than half did. As noted on the previous page, never married adults and those with less educational attainment have been among the groups suffering the biggest losses in income status over this period.
Appendix: Adjusting for Household Size
Household income data reported in this study are adjusted for the number of persons in a household. That is done in recognition of the reality that a four-person household with an income of, say, $50,000 faces a tighter budget constraint than a two-person household with the same income. In addition to comparisons across households at a given point in time, this adjustment is useful for measuring changes in the income of households over time. That is because average household size in the United States has decreased from 3.1 persons in 1970 to 2.5 persons in 2007, a drop of 19%. Ignoring this demographic change would mean ignoring a commensurate loosening of the household budget constraint.
Following the practice of other researchers, this study does not make this adjustment on a simple per capita basis — on the theory that it does not cost twice as much to run a four-person household as it does to run a two-person household. Instead, it adjusts by using a ratio based on the square root of household size. In practical terms, this means that the cost of a one-person house is set at 100; the cost of a two person household is set at 141; the cost of three-person household is set at 173, the cost of a four-person household is set at 200, etc.
As discussed in the main body of the report, adjusting for household size has an effect on trends over time in income since 1970. However, once the adjustment has been made, it is immaterial whether one scales incomes to one-, two-, three- or four-person households. Regardless of the choice of household size, exactly the same results would emerge with respect to the trends in the well-being of lower, middle and upper income groups.
For a more detailed discussion of this and other methodological issues that arose in our research, go to the Appendix on Page 163 of our 2008 Middle Class report.


