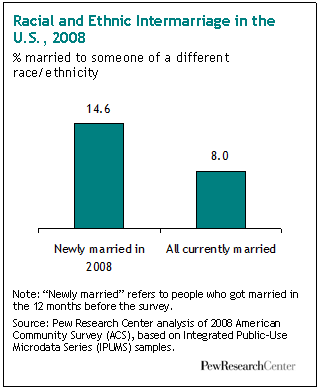
A record 14.6% of all new marriages in the United States in 2008 were between spouses of a different race or ethnicity from each other, according to a Pew Research Center analysis of new data from the U.S. Census Bureau.
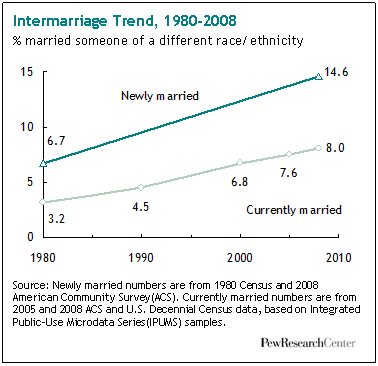
That figure is an estimated six times the intermarriage2 rate among newlyweds in 1960 and more than double the rate in 1980.
This dramatic increase has been driven in part by the weakening of longstanding cultural taboos against intermarriage and in part by a large, multi-decade wave of immigrants from Latin America and Asia.
In 1961, the year Barack Obama’s parents were married, less than one in 1,000 new marriages in the United States was, like theirs, the pairing of a black person and a white person, according to Pew Research estimates. By 1980, that share had risen to about one in 150 new marriages. By 2008, it had risen to one-in-sixty.
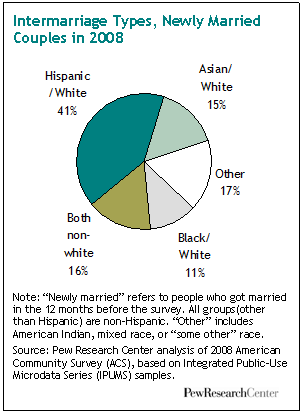
Pairings: Even with that sharp increase, however, black-white couplings represented only about one-in-nine of the approximately 280,000 new interracial or interethnic marriages in 2008.
White-Hispanic couples accounted for about four-in-ten (41%) of such new marriages; white-Asian couples made up 15%; and white-black couples made up 11%.
The remaining third consisted of marriages in which each spouse was a member of a different minority group or in which at least one spouse self-identified as being American Indian or of mixed or multiple races.
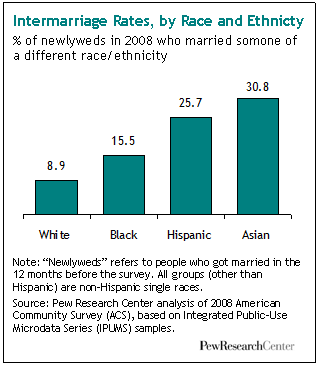
Race, Ethnicity and Immigration: Of the 3.8 million adults who married in 2008, 9% of whites, 16% of blacks, 26% of Hispanics and 31% of Asians married someone whose race or ethnicity was different from their own.
For whites these shares are more than double what they had been in 1980 and for blacks they are nearly triple. For Hispanics and Asians, by contrast, these rates are little changed from 1980. High levels of Hispanic and Asian immigration over the past several decades helped drive both seemingly contradictory trends.
For whites and blacks, the new immigrants and (increasingly) their now grown U.S.-born children have enlarged the pool of potential partners for marrying outside one’s own racial or ethnic group. But for Hispanics and Asians, the ongoing immigration wave has greatly enlarged the pool of potential partners for in-group marrying.
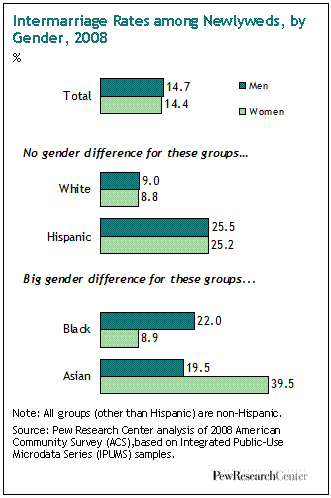
Gender: Among blacks and Asians, there are stark differences by gender in the tendency to marry outside their own racial group. Some 22% of all black male newlyweds in 2008 married outside their race, compared with just 9% of black female newlyweds. Among Asians, the gender pattern runs the opposite way. Some 40% of Asian female newlyweds in 2008 married outside their race, compared with just 20% of Asian male newlyweds.
Among whites and Hispanics, by contrast, there are no gender differences in intermarriage rates. About 9% of both male and female white newlyweds in 2008 married a nonwhite spouse, and about a quarter of both male and female Hispanic newlyweds in 2008 married someone who is not Hispanic.
States and Regions: Intermarriage in the United States tilts West. About one-in-five (22%) of all newlyweds in Western states married someone of a different race or ethnicity in 2008, compared with 13% in the South and Northeast and 11% in the Midwest. All nine states with out-marriage rates of 20% or more in 2008 are situated west of the Mississippi River: Hawaii (48%); Nevada (28%); Oregon (24%); Oklahoma (23%); California (22%); New Mexico (22%); Colorado (21%); Arizona (21%); and Washington (20%). (See Appendix III for a fifty state table).
Regional out-marriage patterns vary in othe r ways. For example, blacks who live in the West are three times as likely to out-marry as are blacks who live in the South and twice as likely as blacks in the Northeast or Midwest.
Among Hispanics, by contrast, the highest rate of out-marriage is in the Midwest (41%) reflecting a general tendency for out-marriage rates to be higher among smaller groups. As for Asians, relatively few live in the South, but those who do are more likely to out-marry (37%) than are those who live in other regions.
The nation’s most populous state, California, presents the following anomaly: in 2008, white (20%) and black (36%) newlyweds were more likely to out-marry than were Hispanics (18%).
In all other states where data are available for these groups, the reverse was true-Hispanic newlyweds out-married at higher rates than did whites or blacks. (See appendix for states and regional table or click here for an interactive map)
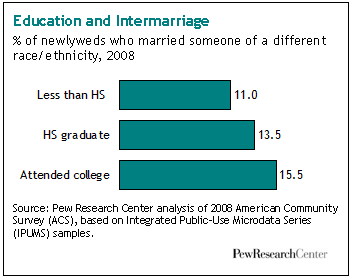
Education: Marrying out is more common among adults who attended college than among those who did not, but these differences are not large. Of all newlyweds in 2008, 15.5% of those who attended college married outside their race or ethnicity, compared with 13.5% of those who completed high school and 11.0% of those who did not complete high school.
Nativity Status: Marrying out is much more common among native-born adults than among immigrants. Native-born Hispanics are more than three times as likely as the foreign born to marry a non-Hispanic.
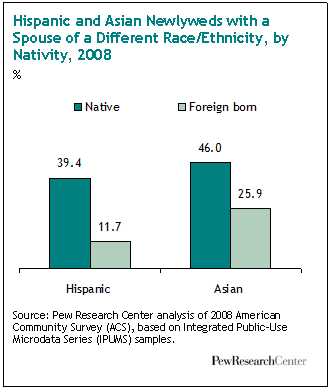
The disparity among native- and foreign-born Asians is not as great, but it is still significant; native-born Asian-Americans are nearly twice as likely as those who are foreign born to marry a non-Asian.
Here again, there are sharp gender differences. Among Asian men, the native born are nearly four times as likely as the foreign born to marry out. Among Asian women, the native born are only about 50% more likely than the foreign born to marry a non-Asian.
All Current Marriages: Another way to measure trends in intermarriage is to look at the full universe of all currently married adults (regardless of when they married).
In 2008, a record 8% of currently married adults had a spouse of a different race or ethnicity. In 1980, this figure was 3.2%.
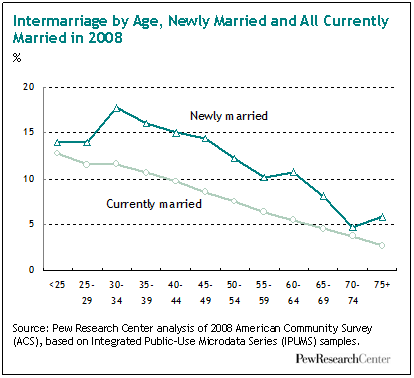
Age Patterns: In the currently married population, intermarriage is strongly correlated with age. Some 13% of all currently married adults ages 25 or younger have married out. That share declines in a linear fashion as the age of the married adult rises. Among married adults ages 75 and older, just 3% have married out.
Among newlyweds in 2008, however, the relationship of intermarriage and age is not as strong. The intermarriage rate is around 15 % for newlyweds under age 50 (the vast majority of all newly weds). Rates decline among newlyweds over age 50.
The Fading of a Taboo: Today’s attitudes and behaviors regarding intermarriage represent a sharp break from the not-too-distant past. For most of this nation’s history, a majority of states had anti-miscegenation laws that made it illegal for whites and nonwhites to marry. Many states repealed these laws after World War II, and the U.S. Supreme Court’s ruling in Loving v. Virginia in 1967 had the effect of declaring unconstitutional anti-miscegenation laws in the 15 states where they were still on the books.
However, attitudinal and behavioral change did not come overnight. As of 1987 — two decades after the Supreme Court ruling — just 48% of the public said it was “OK for whites and blacks to date each other.” By 2009, that share had grown to 83%. Acceptance has risen among all age cohorts, but it is highest among young adults. Among adults ages 18 to 32, 93% approve; among adults ages 64 and older, 68% approve.3
[white American/African-American/Hispanic-American/Asian-American]
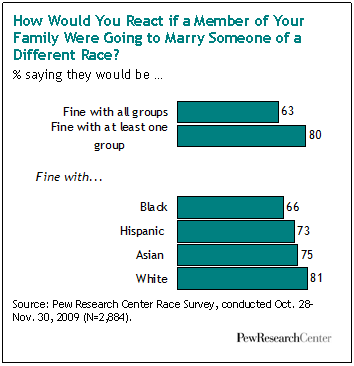
Survey respondents were asked about all major racial and ethic groups except their own. Overall, 63% said it would be fine with them if a family member married “out” to all three other major racial and ethnic groups tested in the survey, and 80% said they would be fine with a new member of their family who came from at least one of the “out” groups.
The survey found that acceptance of out-marriage to whites (81%) is somewhat higher than is acceptance of out-marriage to Asians (75%), Hispanics (73%) or blacks (66%). The survey also showed the flip side of the same coin: Black respondents are somewhat more accepting of all forms of intermarriage than are white or Hispanic respondents. More than seven-in-ten blacks (72%) say it would be fine with them if a family member chose to marry someone who was white, Hispanic or Asian. By contrast, 61% of whites and 63% of Hispanics say they would be fine with a family member marrying someone from any of the other groups.
These racial gaps in acceptance have narrowed in the past decade. Compared with responses to the same questions in 2001, whites have grown somewhat more accepting of interracial marriage and blacks somewhat less.
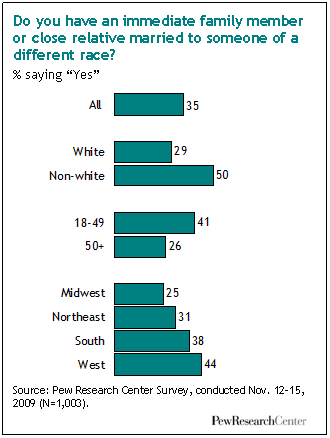
All in the Family: About a third (35%) of all adults say they have an immediate family member or close relative who is married to someone of a different race, according to a newly released Pew Research Center survey finding. Whites are less likely than nonwhites to say this (29% versus 50%), and those ages 50 and over are less likely to say this than those under age 50 (26% versus 41%). Also, 44% of adults living in the West say a family member is in an interracial marriage, compared with 38% of those in the South, 31% in the Northeast and 25% in the Midwest.
Read the full report for more details.


