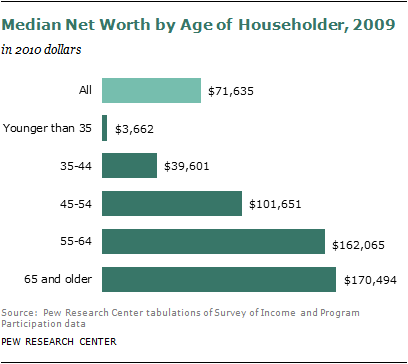
Household median net worth in the U.S. stood at $71,635 in 2009. Across age groups, net worth varied from just $3,662 for households headed by adults younger than 35 to $170,494 for households headed by adults ages 65 and older.
Net worth was $39,601 for households headed by 35- to 44-year-olds, $101,651 for households headed by 45- to 54-year-olds and $162,065 for households headed by 55- to 64-year-olds. Not only are there stark differences in current net worth by householder age, but the trends in wealth holdings over time also diverge dramatically for households headed by younger and older adults.
Younger households in 2009 had sharply lower wealth than did younger households in 1984, while older households had notably more wealth than did older households in 1984.6
Households with heads younger than 35 had household wealth in 2009 that was 68% lower than households with same-age heads in 1984.
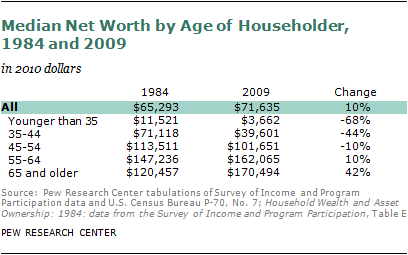
For households with heads ages 35 to 44, wealth was 44% less in 2009 than it had been for same-age households in 1984. For households headed by 45- to 54-year-olds in 2009, net worth was 10% lower than for comparable households in 1984. This pattern reversed for households headed by adults ages 55 and older. Among households with heads ages 55 to 64, wealth was 10% higher in 2009 than it was for comparable households in 1984. Among households headed by adults ages 65 and older, those in 2009 had 42% more wealth than their counterparts in 1984.
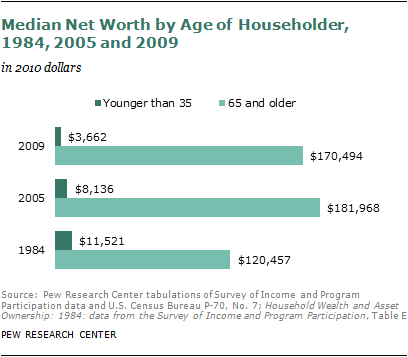
These age-specific trends in net worth mean that the gap between older and younger American households increased dramatically from 1984 to 2009.
In 1984, households headed by adults ages 65 and older already had median net worth that was 10 times the wealth of households headed by adults younger than 35 (or $108,936 more, in absolute terms). In 2009, households headed by the oldest adults had median net worth that was 47 times that of households headed by the youngest adults (or $166,832 in absolute terms).
The wealth gap between younger and older households was expanding even before the national recession began in December 2007. Even then, older households had more wealth than their counterpart households in previous decades, while younger households had less wealth than comparable households did in 1984.
The divergence of wealth was intensified by the recent economic crisis. The youngest households had the largest losses during this time, down 55% by 2009 compared with same-aged households in 2005. Households headed by adults ages 35 to 44 had net worth in 2009 that was 49% less than same-aged households in 2005.
Wealth losses were proportionally smaller for each subsequent age group, with households headed by adults ages 65 and older in 2009 having 6% less net worth than the oldest households in 2005.
Households with No or Negative Net Worth
While median household net worth has increased 10% from 1984 to 2009, the share of households that have zero net worth or negative net worth has also increased.
In 1984, 11% of all households fell into this category, and by 2009, fully one-fifth (20%) of households reported having no positive net worth.
Younger households were far more likely than older households to lack positive net worth. More than one-third (37%) of households headed by people younger than 35 fell into this category in 2009, as did 23% of households headed by adults ages 35 to 44.
Some 17% of households headed by 45- to 54-year-olds had either no wealth or had negative wealth, as did 12% of households headed by 55- to 64-year-olds. Eight percent of households headed by adults ages 65 and older fell into this category.
The gap between young and old on this measure grew markedly from 1984 to 2009, due primarily to the growing share of young households with zero or negative net worth. The share among households headed by adults younger than 35 was 18 percentage points higher in 2009 than it had been in 1984. By comparison, this share was 2 percentage points higher in 2009 among households headed by adults ages 65 and older than it had been in 1984.
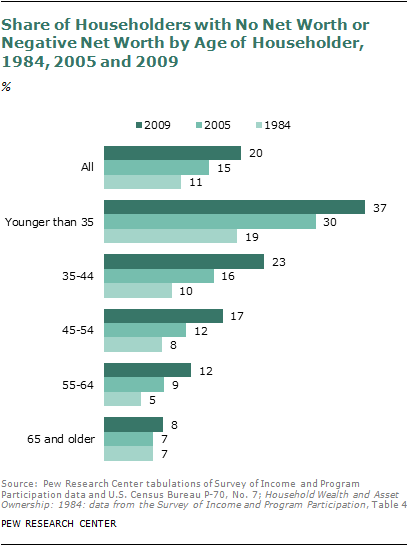
While the divergence in the share of younger and older households with no positive net worth was already well under way by 2005, the onset of the recession sped up the process. Among households headed by people younger than 35, the share with negative or no wealth was seven percentage points higher in 2009 than it had been in 2005. By comparison, the share of households headed by adults ages 65 and older with no wealth or negative wealth was only one percentage point higher in 2009 than in 2005.
Growing Wealth Inequality
Although this report does not delve deeply into how wealth is distributed overall, it is notable that the share of households at the top and bottom of the wealth curve has grown. As shown above, a growing share of all households (and shares of all age groups) has no wealth or negative wealth.
A growing share of households also is at the top of the wealth distribution. In 1984, 6% of households had net worth in that year’s dollars of at least $250,000; in 2009, 13% of households had equivalent net worth in current dollars ($491,572).
In 1984, 1% of households headed by adults younger than 35 had net worth of at least $250,000 in 1984 dollars; in 2009, 2% had equivalent net worth in 2009 dollars. In 1984, 8% of households headed by adults ages 65 and older had a net worth of at least $250,000 in 1984 dollars; in 2009, 20% had equivalent net worth in 2009 dollars.
Housing Component of Wealth
For most Americans, the most important component of wealth is home equity, the difference between the value of a home and the amount owed on its mortgage(s). In 2009, home equity represented 39% of mean total net worth of U.S. households.7 The second most important component, stocks and mutual funds, accounted for a distant 16%.
Because home equity is such a crucial underpinning of wealth for the typical American household, any change in the value of homes has a major impact on net worth. The U.S. housing crisis that began in 2006 and drove down home values was the largest contributor to changes in wealth of the typical household in the past half-decade. Declines in equity were steepest for young homeowners.
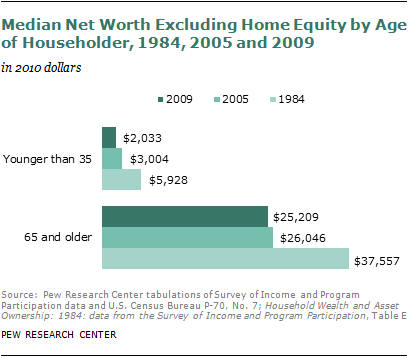
The median net worth of all U.S. households increased to $71,635 in 2009 from $65,293 in 1984, a gain of 10%. However, if home equity is excluded, median net worth shows an 11% decline. Median net worth excluding home equity decreased to $13,899 in 2009 from $15,556 in 1984.
The impact of home equity on wealth is even more decisive for older households. Americans ages 65 and older had a 42% gain in net worth from 1984 to 2009, but if home equity is excluded, their net worth veers into negative territory, declining by 33%. The median net worth of young households, on the other hand, is little affected by excluding home equity—it still drops 66% from 1984 to 2009 (rather than 68% if home equity is included).
The pattern for households headed by adults ages 55 to 64 resembles that of the oldest adults—an overall 10% gain in median net worth from 1984 to 2009 becomes a 6% loss without home equity. Among households headed by adults ages 45 to 54, median net worth does not change from 1984 to 2009 if home equity is excluded. Among households headed by adults ages 35 to 44, a 44% loss becomes a 24% loss if home equity is excluded from net worth.
Home Equity
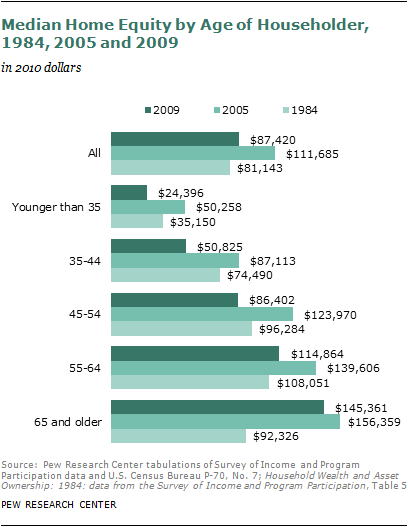
The recent nationwide plunge in housing values affected homeowners in all age groups, but older Americans experienced markedly smaller losses in home equity than younger ones. Older homeowners also had more good fortune over the longer term. Compared with their counterparts in 1984, older homeowners in 2009 had a substantial increase in median value of their home equity while younger ones had a notable loss.

From 2005 to 2009, American households’ median level of home equity dropped by 22%, from $111,685 to $87,420. It dropped most sharply for homeowners younger than 35, whose median equity plunged 51%, to $24,396 in 2009 from $50,258 in 2005. Households with homeowners ages 65 and older were relatively untouched: Their median home equity level declined only 7%, to $145,361 from $156,359. For the age groups in between, change followed a stair-step pattern of larger percentage losses for the younger groups than for the older ones.
Over the longer term, too, the oldest homeowner households have experienced the largest rises in home equity compared with their same-age counterparts in earlier decades, while younger householders have had the largest losses. Overall, the median equity level of owned homes rose 8% from 1984 to 2009. For households with homeowners younger than 35, though, equity was 31% less in 2009 than 1984. For households with owners ages 65 and older, the median equity value rose 57% during this period.
As the accompanying chart shows, the only other group with a gain in median equity from 1984 to 2009 was households with homeowners ages 55 to 64, who gained 6%. Householders ages 35 to 44 experienced a loss of 32% over the 1984-2009 period; those ages 45 to 54 experienced a 10% loss.
Homeownership Rates
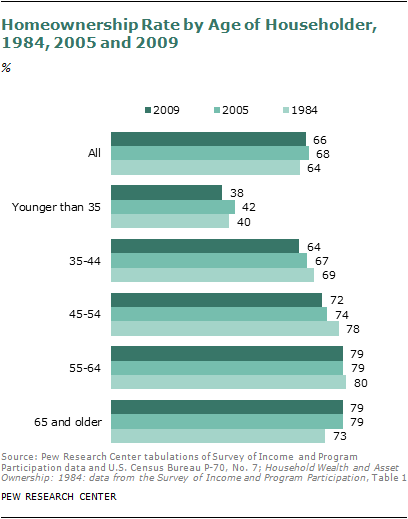
Two-thirds of American householders (66%) owned their homes in 2009.8 As might be expected, older households are more likely than younger ones to own a home, which helps account for their greater wealth.
Although home equity is the largest source of American household wealth, other types of assets are more widely owned. They include motor vehicles (84%) as well as savings accounts and other interest-earning assets at financial institutions (65%).
The U.S. homeownership rate has declined since 2005, when it was 68%, but has risen since 1984, when it was 64%. Only one group had higher homeownership rates in 2009 than in 1984—households headed by adults ages 65 and older. These older householders, as well as householders ages 55 to 64, also had no decline in homeownership from 2005 to 2009.
By contrast, the share of householders younger than 35 who own homes fell to 38% in 2009 from 42% in 2005, the largest percentage point decline among age groups. In 1984, 40% of householders in this age group owned their own homes.
The share of owners in 2009 was lower than in both 2005 and 1984 for householders ages 35 to 44 and householders ages 45 to 54. Among 55- to 64-year-olds, homeownership was steady from 2005 to 2009 but has edged downward since 1984.
Portfolio Value of Homes
Among all households, both renters and owners, owned homes represented 39% of mean total net worth in 2009. The share of wealth represented by a home depends on the home’s value and on the value of other assets in a household’s portfolio, offset by debt.
Among households headed by adults ages 65 and older, 44% of mean total wealth in 2009 was in the value of their home. For the comparable age group in 1984, the home represented just 39% of total wealth.
For households headed by adults younger than 35, an owned home accounted for 31% of mean net worth in 2009, down from 46% in 1984. The share of mean total net worth accounted for by home equity among these young adults had been 52% in 2005, before the national fall in housing prices.
This decline in housing’s share of mean net worth for young households—from 52% of net worth in 2005 to 31% of net worth in 2009—was much steeper than the decline for the oldest households. For households headed by adults ages 65 and older, housing represented 51% of mean net worth in 2005 and 44% in 2009.


