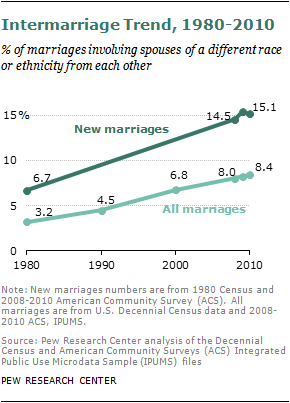
 Marriage across racial and ethnic lines continues to be on the rise in the United States. The share of new marriages between spouses of a different race or ethnicity from each other increased to 15.1% in 2010, and the share of all current marriages that are either interracial or interethnic has reached an all-time high of 8.4%.1
The upward trend of intermarriage is many decades old. In 1980, fewer than 7% of new marriages were intermarriages, less than half the share now.2 Among all marriages, the share of intermarriages in 1980 was about 3%.
At first glance, newlyweds between 2008 and 2010 who “married out” are very similar to those who “married in,” judging by characteristics such as education, income and age. In about one-in-five of each group, both the husband and wife are college graduates. The couples’ combined (median) annual earnings are about $56,700 for the intermarried and $55,000 for those who married in. The average age of brides is about 32 years for both groups, and the age gap between the husband and wife is similar. One exception is geographic differences: Intermarried newlyweds are more likely than newlyweds who married in to live in the Western states of the U.S. (35% vs. 22%) and less likely to live in the Midwest region (16% vs. 23%).
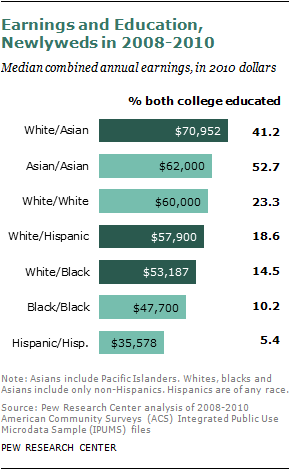 However, there are sharper differences among newlyweds based on the race, ethnicity and gender partnerships of the couples. Some of these differences appear to reflect the overall characteristics of different groups in society at large, and some may be a result of a selection process. For example, among intermarried newlywed couples involving whites, white/Asian couples have the highest combined annual earnings (nearly $71,000), much higher than the earnings of white/Hispanic couples (about $58,000) as well as white/black couples (about $53,000).
Also, white/Asian couples have higher combined earnings than either white/white or Asian/Asian couples. Meanwhile, the combined median earnings of white/Hispanic couples are lower than those of white/white couples but higher than those of Hispanic/Hispanic couples. The earnings of intermarried white/black couples fall between those of white/white and black/black couples.
When it comes to education, white newlyweds who married Asians are more educated than whites who married whites, blacks or Hispanics. More than half of the white men (51%) and white women (57%) who married an Asian spouse are college-educated, compared with only 32% of white men and 37% of white women who married a white spouse. Also, about six-in-ten Asian newlyweds who married whites are college-educated.
Newlywed Hispanics and blacks who married a white spouse are more likely to be college-educated than those who married within their group. About 23% of Hispanic men who married a white wife have a college degree, compared with just 10% of Hispanic men who married a Hispanic woman. Likewise, one-in-three (33%) Hispanic women who married a white husband are college-educated, compared with about 13% of Hispanic women who “married in.” The educational differences among blacks who “marry in” and “marry out” are less dramatic but follow a similar pattern.
Public Attitudes
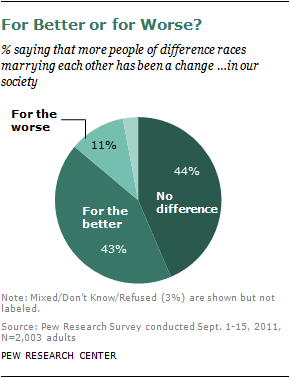 Findings from a number of recent Pew research surveys show that just as intermarriage has become more common, public attitudes have become more accepting. More than four-in-ten Americans (43%) say that more people of different races marrying each other has been a change for the better in our society, while only about one-in-ten think it is a change for worse. Being a minority, younger, more educated, liberal and living in the Eastern or Western states are all traits associated with those who think more positively about intermarriage.
Americans’ growing acceptance of intermarriage is echoed on a personal level. More than a third (35%) of adults say they have an immediate family member or close relative who is married to someone of a different race. And nearly two-thirds of Americans (63%) say they “would be fine” if a family member were to marry someone outside their own racial or ethnic group. Back in 1986, the public was divided about this. Nearly three-in-ten Americans (28%) said people of different races marrying each other was not acceptable for anyone, and an additional 37% said this may be acceptable for others, but not for themselves. Only one-third of the public (33%) viewed intermarriage as acceptable for everyone.3
Demographic Traits
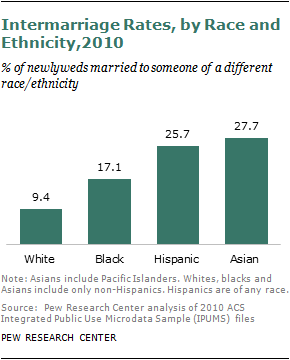 Race and Ethnicity: Among the four major racial and ethnic groups in the U.S., Asians and Hispanics have the highest level of intermarriage rates. In 2010, more than a quarter of newlyweds in each group married someone of a different race or ethnicity. The intermarriage rate among blacks is somewhat lower; about one-in-six (17%) newlywed blacks married non-blacks. Less than one-in-ten whites (9%) married someone who is not white, the lowest among all groups.
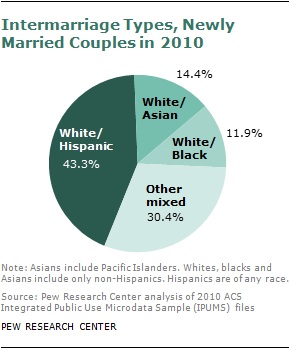 Whites are by far the largest racial group in the U.S., meaning that even though the intermarriage rate is relatively low among whites, marriages between whites and minority groups are the most common types of intermarriage.4 In 2010, seven-in-ten (70%) new intermarriages involved a white spouse. Of approximately 275,500 new interracial or interethnic marriages in 2010, white/Hispanic couples accounted for more than four-in-ten (43%), white/Asian couples made up 14% and white/black couples made up 12%.
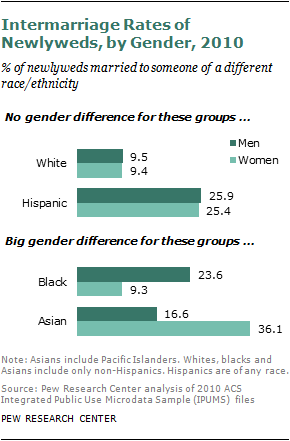 Gender: Among blacks and Asians, there are significant differences by gender in the tendency to marry outside their racial group. Black men are more than twice as likely as black women to marry someone outside their race, and the reverse pattern holds true for Asian men and women. In 2010, nearly one-quarter of black male newlyweds (24%) married outside their race, compared with just about 9% of black female newlyweds. In contrast, more than one-in-three (36%) Asian female newlyweds in 2010 married someone who is non-Asian, compared with only about one-in-six Asian male newlyweds (17%).
Among whites and Hispanics, there are no gender differences in intermarriage rates. About 9% of both male and female white newlyweds in 2010 married a nonwhite spouse, and about a quarter of both male and female Hispanic newlyweds in 2010 married someone who is not Hispanic.
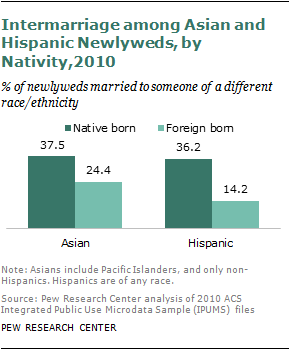 Nativity Status: Marrying out is much more common among the native-born population than among immigrants. Native-born Hispanics were nearly three times as likely as their foreign-born counterparts to marry a non-Hispanic in 2010. The disparity among native- and foreign-born Asians is not as great, but still significant: Nearly four-in-ten native-born Asians (38%) and nearly a quarter (24%) of foreign-born Asians married a non-Asian in 2010.
Among Asian newlyweds, the intermarriage gap between native and the foreign born is much bigger for Asian men than for Asian women. In 2010, native-born Asian male newlyweds were about three times as likely as the foreign born to marry out (32% vs. 11%). Among newlywed Asian women, the gap between native and foreign born is much smaller (43% vs.34%). The gender differences are not significant among Hispanic native- and foreign-born newlyweds.
Regions and States: Intermarriage in the United States tilts West. About one-in-five (22%) of all newlyweds in Western states married someone of a different race or ethnicity between 2008 and 2010, compared with 14% in the South, 13% in the Northeast and 11% in the Midwest.
At the state level, more than four-in-ten (42%) newlyweds in Hawaii between 2008 and 2010 were intermarried; the other states with an intermarriage rate of 20% or more are all west of the Mississippi River. For marriages between whites and Hispanics, states with the highest prevalence rates are New Mexico (19%), Arizona (12%) and Nevada (11%). The highest shares of intermarried white and Asian couples are in Hawaii (9%), District of Columbia (7%) and Nevada (5%). And the top states for white/black intermarried couples are Virginia (3.3%), North Carolina (3.2%) and Kansas (3.0%).
 Backdrop and Recent Changes: The increasing popularity of intermarriage in the U.S. happens at a time when fewer people are getting married and the share of adults currently married has reached a historic low.5 The number of new marriages in the U.S. has declined from approximately 2.3 million in 2008 to 2.1 million in 2010. Only about half of U.S. adults (51%) are currently married. The share is highest among Asians (61%) and lowest among African Americans (31%), with whites (55%) and Hispanics (48%) in between.
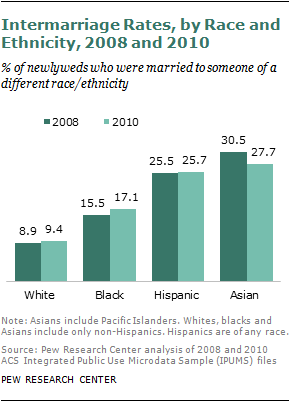
The overall upward trend of intermarriage has masked some group differences in the past few years. The share of Asian newlyweds who intermarry has actually declined from 30.5% in 2008 to 27.7% in 2010.6 In contrast, intermarriage has become more popular among blacks: the share of black newlyweds who intermarry increased from 15.5% to 17.1% during the same time period. The share among Hispanic newlyweds remains the same, and there is a slight increase (0.5 percentage points) among whites who intermarried. Despite the small shifts of intermarriage among Asians and blacks, the overall racial and ethnic composition in pairings among intermarried newlyweds has been steady.
The slight decline of intermarriage rates among Asian newlyweds between 2008 and 2010 is on a similar scale for both Asian males and females (about a 3-percentage-point drop for each). However, the increase in the intermarriage rate among black newlyweds is slightly more pronounced among males than females. The share of black male newlyweds marrying a non-black spouse increased from 21.7% in 2008 to 23.6% in 2010, a rise of nearly 2 percentage points. The rate for black female newlyweds increased by 1 percentage point.
Intermarriage rates for both native- and foreign-born Asians declined between 2008 and 2010, but the drop is much more significant for native-born Asians (from 47% to 38%) than for foreign-born Asian newlyweds (from 26% to 24%). In comparison, the intermarriage rate has declined slightly for native-born Hispanics (from 39% to 36%) during the same period, but increased slightly for foreign-born Hispanics (from 12% to 14%).
Looking back in time: Variances between newlywed couples who married out and those who married in were also found among couples who married at an earlier time, but in a somewhat different manner. For example, in the 2008 to 2010 period, there is virtually no difference in the share of first-time marriages between those who married out and married in (58% for those who married in; 59% for those who married out). However, among the couples who got married prior to 1980 and are still married, the share of marriages between spouses who married for the first time is higher among intra-married couples than intermarried couples (84% vs. 74%).
Among couples who got married before 1980 and are still married, intermarried white/black couples have somewhat higher education level than white/white couples: about 20% of white/black couples are college-educated, compared with 18% of white couples. But about 17% of white/black couples who got married in the past decade (2000-2010) are college-educated, compared with 26% of white couples.
As far as the age difference goes, intermarried white men are slightly older than their Asian wives (1.2 years) for the cohort that got married prior to 1980; the age difference increases to nearly five years (4.8) among the same type of couples who married in the past decade. The age difference among white couples is the same for both cohorts.
Divorce. Several studies using government data have found that overall divorce rates are higher for couples who married out than for those who married in—but here, too, the patterns vary by the racial and gender characteristics of the couples. An analysis conducted a decade ago found that 10 years after they married, interracial couples had a 41% chance of separation or divorce, compared with a 31% chance among couples who married within their race, according to a study based on the 1995 National Survey of Family Growth (NSFG).7 A subsequent study which analyzed 2002 NSFG data found that “although interracial marriages overall are more vulnerable to divorce, this reflects the experience of some but not all couples.” It found that after 10 years of marriage, interracial marriages that are most vulnerable to divorce involve white females and non-White males (with the exception of white females/ Hispanic white males) relative to white/white couples. Conversely, there is little or no difference in divorce rates among white men/non-white women couples, and white men/black women couples are actually substantially less likely than white/white couples to divorce by the 10th year of marriage.8
Another study using 1990 to 2001 data from the Survey of Income and Program Participation (SIPP) suggests that on the whole, interracial marriages are less stable than same-race/ethnicity marriages, but marital dissolution was found to be strongly associated with the race or ethnicity of the individuals in the union. The authors found that “the results failed to provide evidence that interracial marriage per se is associated with an elevated risk of marital dissolution.”9 Mixed marriages involving blacks and whites were the least stable followed by Hispanics-white couples, whereas mixed marriages involving Asians and whites were even more stable than same-race white marriages.
