This chapter provides a detailed look at the economic and demographic characteristics of intermarried newlyweds in comparison with those who married in. To include a bigger sample size for subgroups, analyses of characteristics of newlyweds in this report are based on a combined three-year (2008-2010) dataset of newlyweds.
The analyses start with the overall comparison between intermarried and intra-married couples, and then present a second layer of comparisons among seven pairs of newlyweds who are either of same race/ethnicity or intermarried with whites (white/Hispanic, white/Asian, white/black), and a third layer of comparisons among all newlyweds by the race or ethnicity of the husband and wife. Only intermarried couples involving a white spouse were analyzed for characteristic comparisons, and they represent about 68% of all intermarried newlyweds from 2008-2010.
In addition to couples’ characteristics, this chapter presents the individual level characteristics of men and women who married out compared with those who married in.
Except for a few areas, newlywed intermarried couples are not that different from newlyweds who married within their own racial or ethnic group, measured by a series of demographic and economic characteristics.
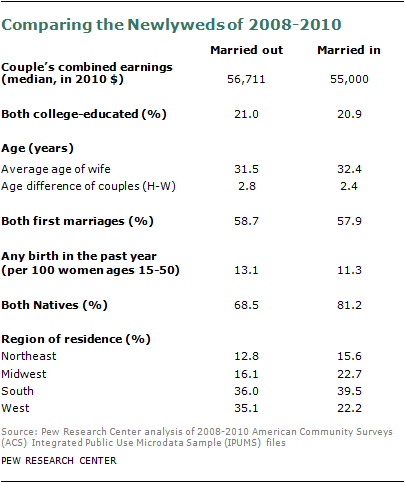
Newlyweds who married out differ the most from those who married in by nativity and region of residence. Mixed couples are less likely than non-mixed couples to be both native born. Nearly seven-in-ten mixed couples (68.5%) are both native-born U.S. citizens, compared with 81% of non-mixed couples who fall in the same category.
Geographically, mixed couples are more likely to live in the Western states of the U.S. and less likely to live in the Midwest region than the same-group couples, perhaps in part because of the population diversity of these regions.
However in many ways these two groups are not that different: Couples in a mixed union have somewhat higher combined earnings than those who are from the same racial or ethnic group ($56,711 vs. $55,000). Newlyweds in mixed couples are equally likely as those in non-mixed couples to be both college educated.
Age of the spouses in the two types of unions is similar, and the age difference between husband and wife is only slightly bigger in mixed couples than for couples of same race and ethnicity (2.8 years vs. 2.4),
When looking at detailed combinations of newlywed couples by race and ethnicity, sharper differences emerge.
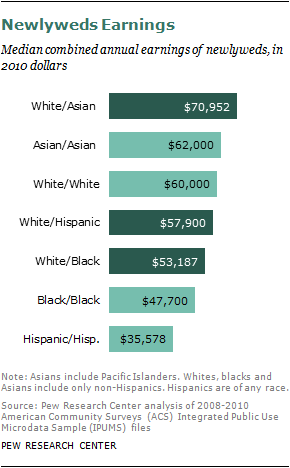
Earnings: White-Asian intermarried couples have higher earnings than both same-race white and Asian couples. Among seven pairs of newlyweds who are either of same race or intermarried with whites, the white/Asian newlywed couples have the highest combined (median) annual earnings of nearly $71,000, followed by couples whose husband and wife are both Asian ($62,000), and those whose husband and wife are both white ($60,000).
White/Hispanic intermarried couples have higher combined earnings than Hispanic couples (same ethnicity), but make less than white couples. A similar pattern applies to white/black couples in comparison to (same race) black couples and white couples. Newly married couples whose husband and wife are both Hispanic make the lowest combined earnings of about $35,600 per year. Black couples are doing better, with about $12,000 more than the Hispanic couples. In contrast, Hispanics who married whites have a combined earning of $57,900, much higher than Hispanics who married in. Similarly, black/white couples make higher earnings than black/black couples (about $53,200 vs. $47,700). Meanwhile, both white/Hispanic and white/black intermarried newlyweds have a lower combined earning than newlyweds whose husband and wife are both white.
The earning differences of couples reflect the general pattern of income disparity among families of different racial and ethnic background in the U.S. In 2009, the median family income was $75,027 for Asians, $62,545 for whites, $39,730 for Hispanics, and $38,409 for black families.10
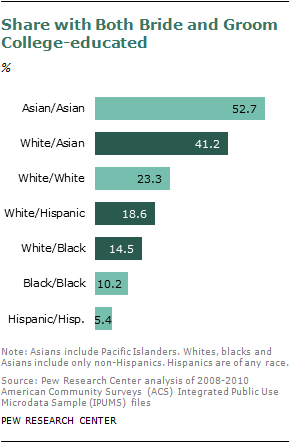
College Education: Higher education is often associated with higher income, although it is not exactly true for couples whose husband and wife are both Asian. More than half of Asian newly married couples (53%) are college-educated (including both husband and wife). In contrast, about four-in-ten white/Asian newlyweds (41%) are college-educated. Yet, Asian couples have less combined earnings than white/Asian intermarried couples.11
Consistent with the pattern found in couples’ combined earnings, education level of intermarried white/Hispanic couples falls between white couples and Hispanic couples. The share of college-educated couples (both husband and wife) is nearly a quarter (23%) among newly married white couples, less than one-in-five (19%) among intermarried couples between white and Hispanic, and only 5% among Hispanic couples. Similarly, intermarried white/black newlyweds are more likely than black couples to be college-educated (15% vs. 10%), but less likely than white couples (23%).
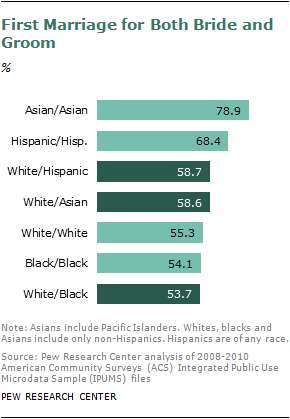
First Marriage: For more than four-in-ten (42%) newlyweds who got married in 2008-2010, it was not the first marriage for either one or both spouses. First-time newlyweds (for both bride and groom) made up about 58% of all newly married couples in that period. About one-in-five (20.5%) new marriages were for couples of whom both the bride and the groom had been married before, and the rest involved one who had been married before, one not.
The vast majority of Asian and Hispanic couples who “married in” are first-time newlyweds (79% and 68%). The share among intermarried white/Hispanic couples as well as white/Asian couples is lower, about six-in-ten (59%).
First-time marriage rates among whites who married in are slightly lower (55%), and a similar share of black and intermarried white/black couples wed for the first time (about 54%).
Regions and States: Compared with couples who married in, intermarried couples are more likely to live in the West (35% vs. 22%) and less likely to live in the Midwest (16% vs. 23%). Consistent with the general population distribution in the U.S., more newlyweds live in the South and fewer of them in the Northeast. About four-in-ten newlyweds (39%) live in the South, and only 15% of them live in the Northeastern states. About one-quarter of newlyweds (24%) live in the West and the rest live in the Midwest (22%).
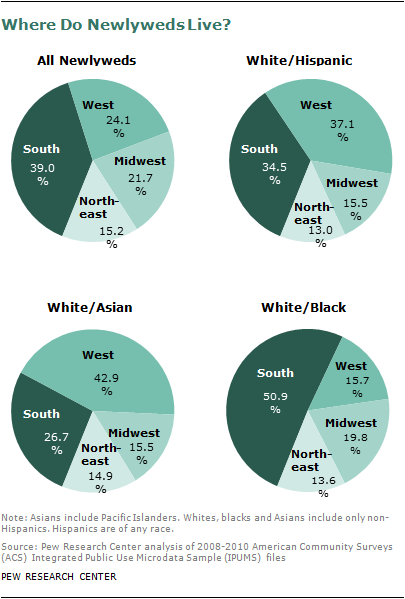
There are some regional patterns about where different intermarried couples live, and the differences are more significant in the South and the West. Compared with all newlyweds, white-Hispanic and white-Asian newlyweds are more likely to live in the Western states (37% and 43%, respectively). Yet intermarried white/black newlyweds are more likely to call the Southern states home: Over half of the white/back couples live in the South, while only about one-in-six (16%) of them live in Western states.
The geographic distribution of intermarried couples is generally in line with where the minority groups are concentrated. According to the same data source of 2008 to 2010 American Community Survey, nearly six-in-ten adult African Americans (57%) live in the South, while almost half of Asian Americans (48%) and four-in-ten Hispanics (41%) live in Western states.
The intermarriage rate in the Unites States tilts West as well, judging by the share of intermarried newlyweds out of all newlyweds. About one-in-five (22%) of all newlyweds in the Western states between 2008 and 2010 married someone of a different race or ethnicity, compared with 14% in the South, 13% in the Northeast, and 11% in the Midwest.
At the state level, Hawaii has the highest intermarriage rate among newlywed couples. More than four-in-ten (42%) newlyweds in Hawaii from 2008-2010 were intermarried. Out-marriage rates of 20% or more occurred in Oklahoma (26%), Nevada (26%), New Mexico (25%), Alaska (24%), California (23%), Arizona (22%), Washington (21%) and Oregon (20%)—all situated west of the Mississippi River.
Nearly one-in-five (19%) of all newlyweds in New Mexico between 2008 and 2010 were white/Hispanic couples, which makes New Mexico the No. 1 state in terms of the prevalence of white/Hispanic couples. States with the next highest shares of newlywed white/Hispanic couples were Arizona (12%) and Nevada (11%).
The highest rates of newlywed white/Asian couples are in Hawaii (9%), the District of Columbia (7%) and Nevada (5%). And the top three states for white/black intermarried couples are Virginia, North Carolina and Kansas, which all have rates of about 3%.
In contrast, white couples are more prevalent in the Midwest, where 77% of newlywed husbands and wives from 2008 to 2010 were both white. Western states have the lowest share of white couples among newlyweds; only about half of the newlyweds are white couples. On the state level, Vermont has the highest proportion of newlywed white couples. Among newlywed married in 2008-2010, 94% in Vermont were white couples, followed by Maine (92%) and West Virginia (88%). At the same time, in Hawaii, only a quarter of newlyweds were white couples, and the share in New Mexico and California was only 34% and 36%, respectively.
For more details about the state and region level information of newlyweds, see Appendix 2.
Ranking the Newlyweds by Husband and Wife’s Race/Ethnicity
By husband and wife’s race or ethnicity, newlyweds are further divided into 10 groups, including four groups of intra-married couples (white, Hispanic, Asian and black) as well as six types of mixed couples involving a white husband or wife. The couple is indicated in the format that the husband’s race/ethnicity goes first and the wife’s race/ethnicity goes second. For example, “Asian/white” refers to couples in which the husband is Asian and the wife is white.
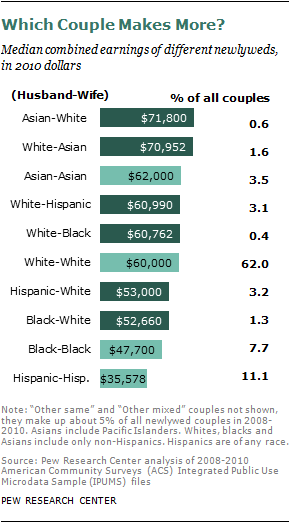
Earnings: Newly married couples formed between an Asian husband and a white wife represent less than 1% of overall newlyweds, yet they have the highest combined earnings among all newlyweds, with combined (median) annual earnings of $71,800. The second-highest earnings are for couples in which the husband is white and the wife is Asian; their combined earnings are nearly $71,000.
Newlywed couples whose husband and wife are both Asian make $62,000 a year, which puts them third on the earnings list. They are also the highest-paid couples among all four types of newlyweds composed of a bride and groom from the same race or ethnicity.
Both male and female Asian newlyweds who married whites have higher combined earnings with their spouse than those who married other Asians. The same pattern goes for white newlyweds who married Asians: Their combined earnings with their Asian spouses are higher than those of their counterparts whose spouse is white.
Some noticeable gender patterns: In addition to Asian men, all intermarried white male newlyweds, as well as black and Hispanic newlyweds who married a white woman, have higher combined earnings with their spouses than their counterparts who married in. Combined median earnings for Hispanic grooms with a white wife are $53,000, but only about $35,600 for Hispanic grooms who married a Hispanic wife. Similarly, combined couple earnings for black grooms who married a white wife (around $52,700) are higher than blacks who married in ($47,700). The earning difference is less significant for white grooms, but those who married a Hispanic or black wife still have slightly higher combined earnings with their wife than their counterparts who married a white wife.
It is a somewhat different story for brides: Asian brides who married a white husband have higher combined earnings than their counterparts who married an Asian husband. Hispanic and black brides who married a white husband also have significantly higher combined earnings with their husbands (around $61,ooo) than their counterparts who married within their own racial or ethnic group (less than $48,000). White brides who married Hispanic or black husbands, on the other hand, have slightly lower combined earnings than their counterparts who married a white husband. However, combined earnings for white brides with an Asian husband are much higher than for white brides who married in.
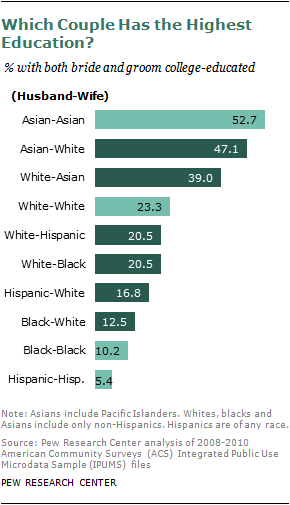
College Education: Consistent with their highest educational achievement in general, Asian newlywed couples (both bride and groom are Asian) rank as the most highly educated couple. More than half of Asian couples (53%) include a husband and wife who are both college-educated.
Asian husbands with a white wife rank second in terms of college education; slightly less than half of couples in this group are both college-educated (47%). In contrast, about four-in-ten couples (39%) comprising a white husband and an Asian wife are both college-educated, which ranks them third.
Intermarried couples between whites (men and women) and Hispanics or blacks are less likely to both be college-educated than couples in which both husband and wife are white. About 21% of couples made up of a white husband and a Hispanic or black wife are college-educated, compared with 23% of white couples. And the gaps between white couples and couples involving a white wife and a Hispanic or black husband are bigger. Only about 17% of couples consisting of Hispanic men and white women and 12% of couples consisting of black men and white women are college-educated, compared with nearly a quarter of the white couples (23%).
On the flip side, compared with their counterparts who married in, Hispanics and blacks (both men and women) who married whites are more likely to be in a union where both partners are college-educated.
First Marriage: For newlyweds who married between 2008 and 2010, nearly six-in-ten (58%) were married for the first time (both bride and groom).
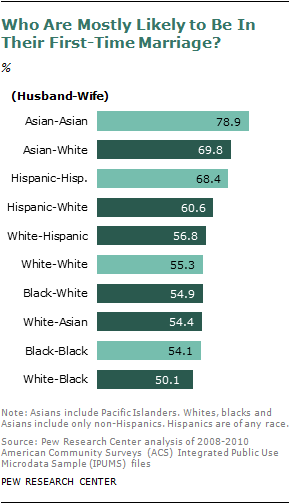
Nearly eight-in-ten Asian couples (79%), well above the average share, were first-time newlyweds, the highest share among all researched newlyweds in this study.
Couples made up of an Asian husband and a white wife rank second: about seven-in-ten (70%) of them were first-time newlyweds. However, when the husband is white and the wife is Asian, the share of first-time newlyweds is only 54%.
Hispanics couples ranked third on the list, with 68% of them being first-time newlyweds. Intermarried couples between Hispanic and white are slightly less likely to be first-time newlyweds than Hispanic couples. Unlike Asian-white couples, the difference is not big between Hispanic husband/white wife couples (61%) and white husband/Hispanic wife couples (57%).
For about 55% of white newlyweds (both husband and wife white), it was their first marriage. This share is virtually equal among couples of black husband/white wife, white husband/Asian wife, and black husband/black wife (black couples). The newlywed couples consisting of a white man and a black woman have the lowest share of being first marriage for both (50%); about half of them have at least one spouse who has been married before.
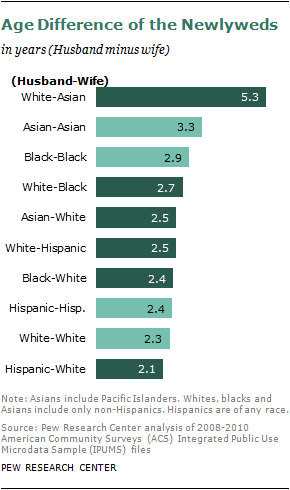
Age Difference: Among newlyweds married between 2008 and 2010, the husband is on average about 2.5 years older than his wife. With an age difference of more than five years, newlyweds involving a white husband and an Asian wife top the list in terms of age differences.
Asian and black newlywed couples who “married in” also have a relatively larger age difference between the husband and wife. On average, an Asian husband is more than three years (3.3) older than his wife who is also Asian, and a black husband is nearly three years (2.9) older than his wife of same race.
The age difference between husband and wife is more similar among the rest of couples, which ranges from 2.1 years (Hispanic husband/white wife) to 2.7 years (white husband/black wife).
Intermarried Men and Women
Differences between couples who intermarried and those who married in are largely due to the characteristics of individual men and women who made the choices about whom to marry.
Are the individuals who choose to marry out any different from their counterparts who marry in? This section compares the education levels of newlyweds by whom they marry. Whites, Hispanics, blacks and Asians are examined separately, for both men and women in each group.
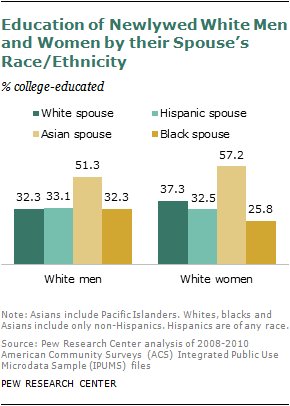
Newlywed white men who married Asian wives are more likely than those who married in to be college graduates (51% vs. 32%). White men who married Hispanic or black women are about equally educated as those who married white women. Similarly, newlywed white women who married Asian men are significantly more educated than those who married white men. About 57% of white women who married Asian men are college-educated, compared with 37% of white women who married in. Yet newlywed white women who married Hispanic men are somewhat less likely to be college graduates than their counterparts who married in (33% vs. 37%). And newlywed white women who married black men are least likely to be college graduates (26%).
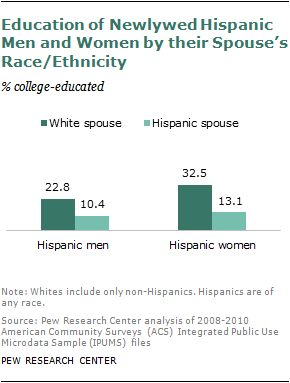
For newly married Hispanic men and women, marrying a white person is associated with a higher education. More than one-in-five (23%) Hispanic men who married a white woman are college-educated, compared with only 10% of Hispanic men who married a Hispanic woman. Similarly, nearly one-in-three (33%) Hispanic women who married a white husband are college-educated, compared with only 13% of their counterparts who married a Hispanic husband.
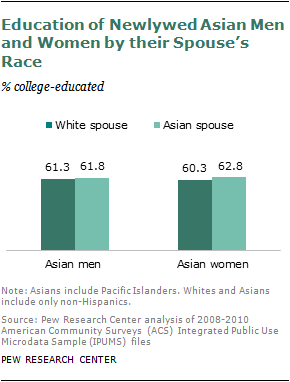
The education selection of those who married out among newlywed Asian men and women are minimal. About six-in-ten newly married Asian men are college-educated, regardless of whether their spouse is white or Asian. Asian women who married whites are slightly less likely than those who married Asians to be college-educated (60% vs. 63%), even though both groups of wives are highly educated.
Finally, newlywed black men and women who married a white spouse are somewhat more educated than their counterparts who married a black spouse, but the difference is not as big as among newlywed Hispanics. About one-in-five (20%) black men who married white women are college-educated, compared with about 18% of black men who married in. For black women, the education selection is a bit more pronounced. More than three-in-ten (31%) black women who married white men are college-educated, compared with less a quarter (24%) of black women who married in.
For more characteristics of individual men and women who marry out, see Appendix 3.


