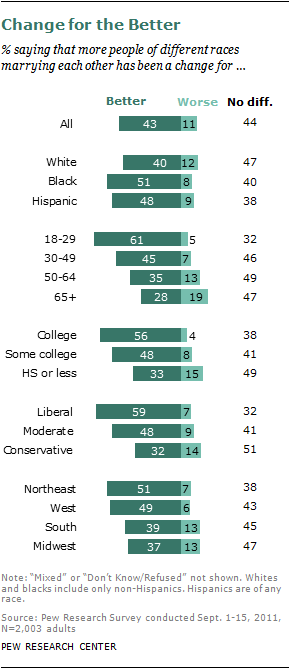
More than four-in-ten Americans (43%) view more intermarriages as a change for the better in our society, while about one-in-ten (11%) say it has been a change for the worse,13 according to a recent Pew Research Center survey. The rest of the public says it doesn’t make a difference.
Being minorities, younger, more educated, liberal and living in the Northeast or Western states are a few characteristics associated with those who think more positively about intermarriage.
More than half of blacks (51%) and 48% of Hispanics say that the increase in intermarriage has been a change for the better in society, compared with four-in-ten whites. Asians are not included in the analysis here given the limited sample size of the group in the survey.14
Younger adults, especially those under 30, are much more positive about intermarriage than older adults. A majority of 18- to 29-year-olds (61%) think more people of different races marrying each other has been a change for the better for society; of adults ages 65 and older, only 28% share the same opinion.
College-educated adults are most likely to think positively about intermarriage than those with less education. More than half of college graduates (including postgraduates) say that more intermarriage is better for society, while only about one-third of adults who have a high school diploma or less and 48% of adults with some college education agree.
Favorable views about intermarriage increases when one is more liberal: Nearly six-in-ten liberals (59%) think that more people of different races marrying each other has been a better change for our society, nearly half (48%) of moderates agree, compared with less than one-third (32%) of conservatives who say so.
There are significant geographic differences associated with people’s opinion on the impact of intermarriages on society. About half of the residents living in the Northeast and the West think more intermarriages is better for society, compared with fewer than four-in-ten residents who live in the South and Midwest.
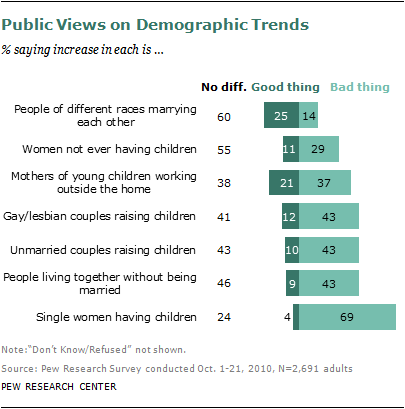
Among the major demographic trends that have transformed Americans’ family life in recent decades, the public is the least critical in its attitudes toward intermarriage.
A 2010 Pew Research survey asked respondents to judge whether a number of trends, ranging from “Single women having children” to “Mothers of young children working outside the home,” are generally a good thing for our society, a bad thing, or don’t make much difference. The trend that elicits the most negative reaction from the public is the increasing number of single women having children without a male partner to help raise them. Nearly seven-in-ten (69%) say this is a bad thing for society. Only 4% say this is a good thing, and 24% say it doesn’t make much difference.
The public is least critical of the increase in interracial marriages: About a quarter say this is good for society, 14% say it is bad and 60% say it doesn’t make much difference. In fact, this is the only trend on the list that more people say it is good than bad.
Other trends in less traditional family arrangements get mixed reviews from the public. More than four-in-ten (43%) say that the trend toward more people living together without being married is bad for society. The same share says it is bad for society if more same-sex couples or unmarried couples raise children.
The Fading of a Taboo
Today’s attitudes and behaviors regarding intermarriage represent a sharp break from the not-too-distant past. For most of this nation’s history, a majority of states had anti-miscegenation laws that made it illegal for whites and nonwhites to marry. Many states repealed these laws after World War II, and the U.S. Supreme Court’s ruling in Loving v. Virginia in 1967 had the effect of declaring unconstitutional anti-miscegenation laws in the 16 states where they were still on the books.
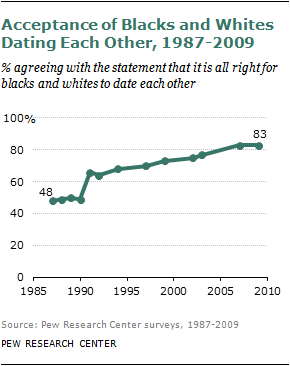
However, attitudinal and behavioral change did not come overnight. As of 1987, two decades after the Supreme Court ruling, just 48% of the public said it was “all right for blacks and whites to date each other.” By 2009, that share had grown to 83%. Acceptance has risen among all age cohorts, but it is highest among young adults. Among adults ages 18 to 29, 93% approve; among adults ages 65 and older, 67% approve.15
Attitudes about interracial marriage are an even a bigger hurdle to get over. In a 1986 Roper Organization survey (through personal interviews), 28% of respondents found “people of different races marrying each other” completely unacceptable, 37% said it would be acceptable for others but not themselves, and only one-third of respondents considered intermarrying acceptable for everyone.16
[white American/African American/Hispanic American/Asian American]
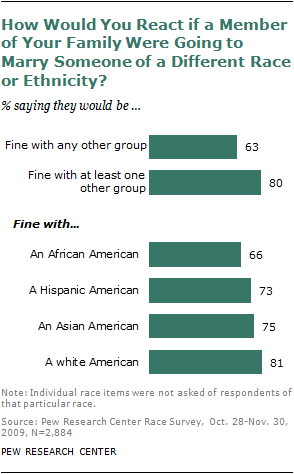
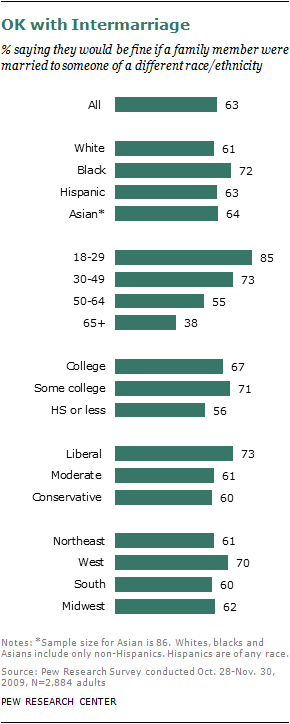
Survey respondents were asked about all major racial and ethnic groups except their own. Overall, 63% say it would be fine with them if a family member married “out” to any of the three other major racial and ethnic groups tested in the survey, and 80% say they would be fine with a new member of their family who came from at least one of the specified “out” groups.
As far as the white-black marriages (not dating), nearly two-thirds of whites (64%) say they would be fine with a family member marrying a black person; an additional 27% say they would be bothered but would come to accept it. Among blacks, eight-in-ten (80%) say it would be fine with them if a family member were to marry a white person, and an additional 16% say they would be bothered about it but would accept it. Just 6% of whites and 3% of blacks say they could not accept a black-white interracial marriage in their family.
The survey found that acceptance of out-marriage to whites (81%) is somewhat higher than is acceptance of out-marriage to Asians (75%), Hispanics (73%) or blacks (66%). The survey also showed the flip side of the coin: Black respondents are somewhat more accepting of all forms of intermarriage than are white or Hispanic respondents. More than seven-in-ten blacks (72%) say it would be fine with them if a family member chose to marry someone who was white, Hispanic or Asian. By contrast, 61% of whites and 63% of Hispanics say they would be fine with a family member marrying someone from any of the other groups.
These racial gaps in acceptance have narrowed in the past decade. Compared with responses to the same questions in 2001, whites have grown somewhat more accepting of interracial marriage and blacks somewhat less.
All in the Family. About a third (35%) of all adults say they have an immediate family member or close relative who is married to someone of a different race.17 Whites are less likely than nonwhites to say this (29% versus 50%), and those ages 50 and over are less likely to say this than those under age 50 (26% versus 41%). Also, 44% of adults living in the West say a family member is in an interracial marriage, compared with 38% of those in the South, 31% in the Northeast and 25% in the Midwest.
A closer look at the public opinion suggests that people’s attitudes toward intermarriage within their own families are mostly consistent with their general views about intermarriage, though with a few disparities.
Similar to their views about intermarriage in general, blacks are more likely than other races to say that they are fine with their family members marrying someone (all three other major racial or ethnic groups) outside their race group. Young adults are much more likely than older adults to accept intermarriage. A vast majority of young adults (85%) of 18- to 29-year-olds accept intermarriage of their family members, compared with fewer than four-in-ten (38%) adults ages 65 and older.
Education is positively linked to people’s personal acceptance of intermarriage. College-educated adults are more likely than those with a high school education or less to accept their family members marrying outside their race or ethnicity. Adults with some college education, though not as positive as college graduates in their views of intermarriage being a change for the better for society, are as likely as college graduates to accept intermarriage at a personal level.
Similar to their general opinions to intermarriages, at the family level, liberals are more likely to accept intermarriage (73%) than are moderates (61%) or conservatives (60%).
Americans who live in the West are more likely than others to say that they are OK with their family members marrying outside their own race or ethnicity. Residents in the Northeast were also more likely than the Southern and Midwestern residents to say intermarriage has been a good change for society, though at the personal level, their acceptance for intermarriage is about the same as residents of the South and Midwest.
Age and Marriage Outside One’s Own Racial/Ethnic Group
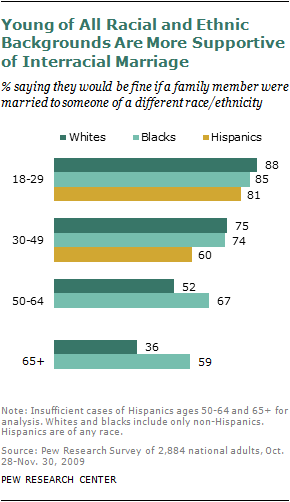
The overall differences between white and black attitudes toward intermarriage are primarily driven by differences among older Americans. Regardless of race, younger Americans (18- to 29-year-olds) overwhelmingly say they would be fine with a family member’s marriage to someone in another ethnic or racial group, with no significant racial differences among this age group. And while 30- to 49-year-olds are somewhat less likely to be accepting of interracial marriage than are younger people, the opinions of whites ages 30-49 are comparable to those of blacks in that age group.
Across racial groups, racially conservative views about interracial marriage are strongly correlated with age. Americans ages 50 and older, and particularly those 65 and older, are considerably less accepting of interracial marriage than are those in younger age groups. While this is true of blacks, it is more strongly pronounced among whites. Just over half of whites ages 50-64 (52%) and only 36% of whites 65 and older say they would be fine with a relative marrying someone from any other racial groups (this is 15 points and 23 points less than blacks in their age groups, respectively).
For whites, blacks and Hispanics, older respondents express greater discomfort with the possibility of a family member marrying someone of a difference race or ethnic group. Resistance to a family member marrying an African American is especially strong among older whites; just 55% of those ages 50-64 and 41% of those 65 and older say they “would be fine” with this. By contrast, more than seven-in-ten older blacks (76% of those ages 50-64 and 71% of those 65 and older) say they would be fine with a family member marrying a white American; among blacks ages 18-29, 89% would be fine with it. And among older whites, acceptance of a relative’s marriage to an African American lags behind acceptance of a family member’s marriage to an Hsipanic or Asian spouse. Among 18- to 29-year-olds there are no differences by race of respondent in the acceptance of marriage to those in other racial and ethnic groups.


