More so than the general public, Asian Americans prefer an activist government, approve of President Obama’s job performance, are satisfied with the direction of the country and identify with the Democratic rather than the Republican Party. However, their political views are similar to those of the general public on two high-profile social issues—homosexuality and abortion.
When it comes to participation in the political process, Asian Americans are also distinctive—but for a different reason. Because about three-in-ten Asian American adults are not citizens and are therefore ineligible to vote, the group’s voting rate falls well below that of the general public. According to the Pew Research survey, about half of Asian Americans say they voted in the 2008 presidential election. By contrast, 67% of all U.S. adults say they voted that year, according to the U.S. Census Bureau’s Current Population Survey.79
This gap disappears, however, on non-electoral measures of civic and community engagement. Some 44% of Asian Americans say they have worked on a community problem over the past year, compared with 38% of the general public that says the same, according to Pew Research surveys.
This chapter explores attitudes about the direction of the country, the president’s job performance, political affiliation and ideology. It also looks at participation of Asian Americans in voting and in civic life. It provides breakdowns among the six largest Asian country of origin groups; among the native born versus the foreign born; citizens versus non-citizens; and wherever appropriate by party affiliation and demographic characteristics.
Direction of the Country
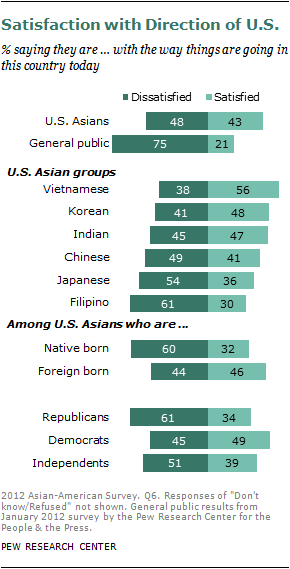
About four-in-ten (43%) Asian Americans are satisfied with the direction of the country, about half (48%) are dissatisfied and the remainder have no opinion. By contrast, just 21% of the U.S. general public are satisfied and three-quarters (75%) are dissatisfied, according to a January 2012 Pew Research survey.
Views about the direction of the country are strongly associated with partisanship. Asian-American Democrats are more satisfied than either Republicans or independents. The same pattern occurs among the general public.
On average, foreign-born Asian Americans are more likely than the native born to be satisfied with the direction of the country (46% vs. 32%). And recent immigrants are more likely than those who arrived before 2000 to be satisfied with the direction of the country (58% vs. 41%).
Among the U.S. Asian groups, Vietnamese Americans are more satisfied with the direction of the country than are other U.S. Asian groups. Filipino Americans and Japanese Americans are less satisfied with the direction of the country than are other country of origin groups. Chinese Americans fall in the middle, with 41% satisfied and 49% dissatisfied with the direction of the U.S. As with Asian Americans as a whole, Chinese Americans who were born in the U.S. are less satisfied than Chinese immigrants with the direction of the country (28% to 44% among foreign-born Chinese Americans).
Presidential Job Approval
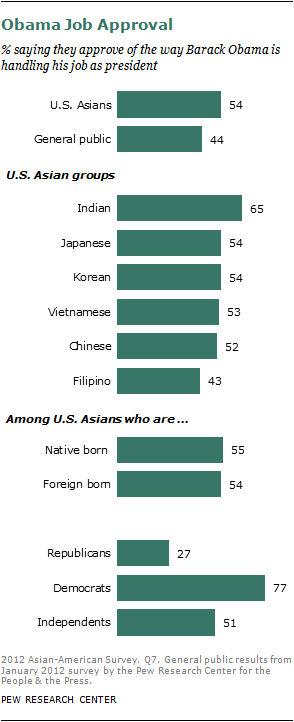
A 54% majority of Asian Americans approve of the job Barack Obama is doing as president, 29% disapprove and 17% have no opinion.
Compared with the general public, Asian Americans are more likely to approve of President Obama’s job performance. Among the U.S. general public, 44% approve and 48% disapprove.
As expected, opinion about Obama’s job performance is strongly associated with partisanship. About three-quarters (77%) of Asian-American Democrats approve of Obama’s job performance, compared with 27% among Republicans and 51% among independents.
Differences across the six U.S. Asian groups are modest, with more approving than disapproving of Obama’s job performance for all but one Asian group. Filipino Americans are split evenly with 43% approving and 43% disapproving of Obama’s performance. Job approval is higher among Indian Americans (65% approve) than it is for the other five U.S. Asian groups.
Native- and foreign-born Asian Americans are about equally likely to approve of the president’s job performance.
Political Party and Ideology
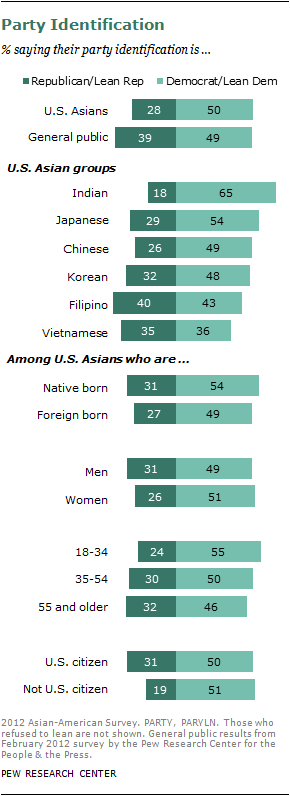
Asian Americans tilt more to the Democratic than the Republican Party. About half (50%) of Asian Americans identify with or lean toward the Democratic Party, 28% identify with or lean toward the Republican Party, and about a fifth (22%) do not lean to either party.
The general public also tilts toward the Democratic Party, but not as strongly. Among the general public, 39% are Republicans or Republican leaners, and 49% are Democrats or Democratic leaners.
There is some variation in partisan leanings among U.S. Asian groups. Filipino Americans and Vietnamese Americans are evenly divided in partisanship. Four-in-ten (40%) Filipino Americans are Republicans or independents who lean to the Republican Party, 43% are Democrats or independents who lean to the Democrats. However, as with U.S.-born Asians overall, native-born Filipino Americans tend to identify with or lean to the Democrats (52% do so, compared with 35% who identify with or lean to the Republicans).
Among Vietnamese Americans, 35% identify with or lean to the Republicans, 36% identify with or lean to the Democrats, and about three-in-ten (28%) do not lean to either party. Vietnamese Americans who are registered to vote are somewhat more likely to be Republican, however; among this group, 47% identify with or lean to the Republicans, 32% identify with or lean to the Democrats, and 21% do not lean to either party.
Indian Americans are the most Democratic-leaning of the six U.S. Asian groups. Nearly two-thirds (65%) of Indian Americans identify with or lean to the Democrats, while 18% identify with or lean to the Republicans.
The tendency to identify with the Democratic more so than the Republican Party is stronger among younger than older Asian Americans. Among those 18 to 34, 55% identify or lean to the Democrats and 24% to the Republicans. Among those 55 years and older, 46% identify with or lean to the Democrats, 32% to the Republicans.
On the other hand, younger Asian Americans are more likely than older adults to be independents, suggesting that partisan ties among younger Asian Americans are relatively weak. Among those 18 to 34 years old, 42% identify as independents, 31% as Democrats and 14% as Republicans. This compares with 24% identifying as independents among those 55 years and older, 36% as Democrats and 23% as Republicans.
Partisan affiliation is roughly the same for Asian-American registered voters as it is for all Asian Americans. Among the registered, 32% are Republican or independents who lean to the Republicans, 52% are Democrats or independents who lean to the Democrats. Among those who are not registered, 29% are Republican or lean to the Republicans and 44% are Democrats or lean to the Democrats.
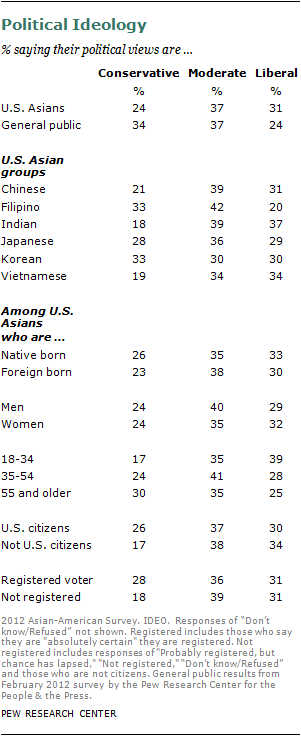
In keeping with their partisan leanings, Asian Americans tilt more toward liberal than conservative. Among all U.S. Asians, 31% describe their political views as liberal, while 24% say they are conservative and 37% say they are moderate.
Among the general public, ideology tilts in the opposite direction; 34% are conservative, 24% liberal and 37% moderate.
Younger Asian Americans (18 to 34 years) are especially likely to be liberal (39%). Some 17% of younger Asian Americans are conservative, and 35% are moderate. Older Asian Americans, ages 55 and older, are split more evenly across ideological groups with 30% conservative, 25% liberal and 35% moderate.
Differences between men and women on ideology are modest.
There is some variation in ideological leanings among U.S. Asian groups. Those of Indian, Vietnamese and Chinese origin are more likely to be liberal than conservative. Japanese Americans and Korean Americans are split evenly between liberals and conservatives. Filipino Americans are more likely to be conservative (33%) than liberal (20%).
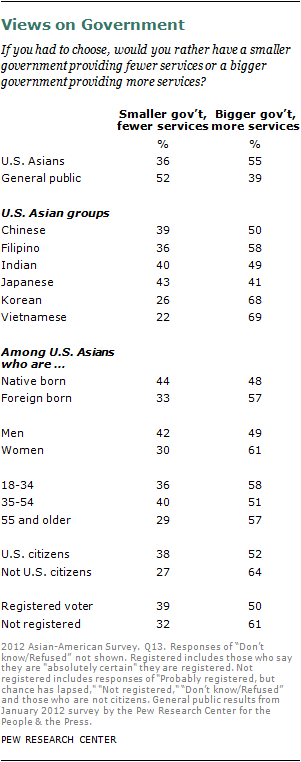
In addition, a 55% majority of Asian Americans prefers a more activist government, meaning one that provides more services, while 36% prefer a smaller government that provides fewer services.
By contrast, 39% of adults in the general public prefer a government that provides more services, while 52% prefer a smaller government that provides fewer services.
Asian American men and women diverge in their views on this subject. About six-in-ten (61%) Asian-American women prefer an activist government, and 30% prefer a smaller government. Among men, about half (49%) prefer an activist government, 42% a smaller government. This pattern also occurs among the general public.
Among U.S. Asian groups, Japanese Americans are evenly divided in their views about the role of government (43% prefer a smaller government, 41% a more activist one). This pattern holds for both native- and foreign-born Japanese Americans. Vietnamese Americans and Korean Americans are the most lopsided in their preference for an activist government.
Civic Participation
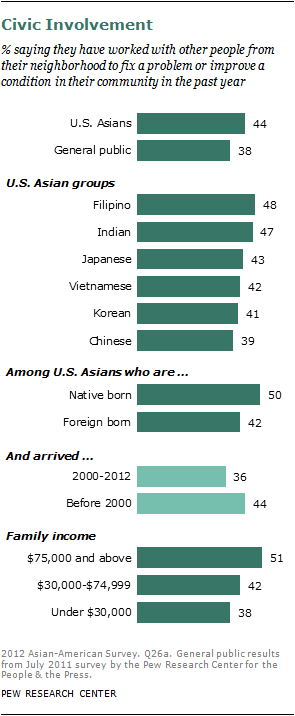
More than four-in-ten (44%) Asian Americans say they have worked on a community problem in the past year. In the general population, 38% say they have done so.
On average, those born in the U.S. are more likely than immigrants to have worked on a community problem in the past year. Asian-American immigrants who arrived before 2000 are more likely than recent immigrants to have done so.
Asian Americans with higher family incomes are more likely than those with lower incomes to have worked on a civic problem (51% versus 38%).
Civic involvement is about the same across gender and age groups.
There are modest differences in civic involvement among U.S. Asian groups; nearly half of Filipino Americans and Indian Americans have worked on a civic problem (48% and 47%, respectively). While 39% of Chinese Americans have worked on a civic problem, there is a sizable difference in civic involvement between native- and foreign-born Chinese Americans; 48% of U.S.-born Chinese have worked on a civic problem, compared with 35% of Chinese immigrants.
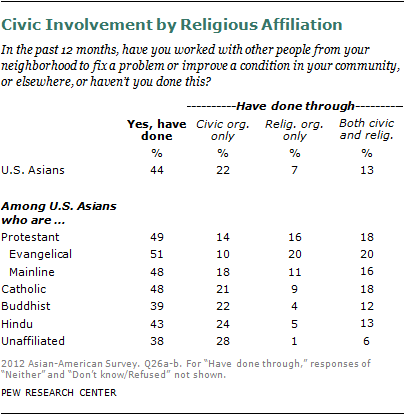
The survey also asked respondents to specify whether these kinds of civic activities come from involvement with civic or religious organizations or both. Their responses suggest a mix of involvement in both kinds of organizations. Overall, more Asian Americans report working on a community problem through a civic organization (22%) than through a religious organization (7%), while more than one-in-ten have done both (13%).
Christian Asians in the U.S. (including Protestants, Catholics and other Christians) are more likely than Buddhists or the religiously unaffiliated to have worked on a community problem.
For the most part, those who have worked on a community problem are more likely to have done so through a civic organization than exclusively through a religious organization. The exception to this pattern occurs among evangelicals. Among evangelical Protestants, 10% have worked through a civic organization, twice as many (20%) have worked through a religious organization, and an additional 20% have worked through both kinds of organizations.
Voting Participation
Citizenship is, of course, a prerequisite for formal participation in the U.S. political system. As noted earlier, 70% of adult U.S. Asians are either U.S.-born or naturalized citizens, according to the American Community Survey conducted by the U.S. Census Bureau. Among those who are foreign born, 59% of U.S. Asians are naturalized citizens.
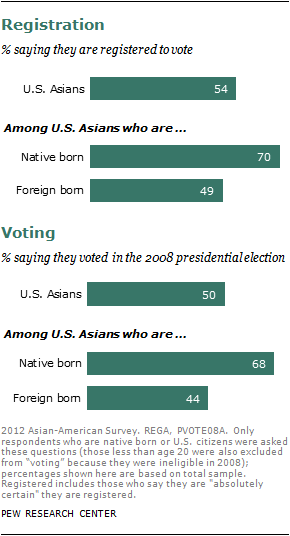
The Pew Research survey finds that 54% of Asian Americans are registered to vote and that half (50%) report voting in the 2008 presidential election.
Native-born Asian Americans are more likely than those who are foreign born to be registered to vote and to have voted in 2008.
Compared with the general public, fewer Asian Americans report being registered to vote or having voted in 2008, a difference that stems largely from lower rates of voter eligibility among Asian immigrants. Native-born Asian Americans are about equally likely as citizens in the general public to be registered. Seven-in-ten (70%) native-born Asian Americans say they are registered to vote. Among the general public, 71% are registered.80
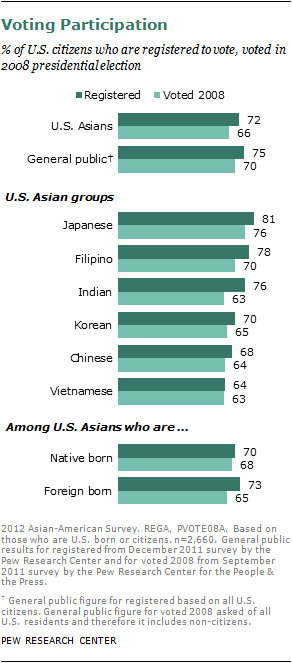
Asian-American citizens, whether native born or foreign born, are about equally likely as citizens in the general public to be registered to vote. Fully 72% of Asian-American citizens are registered, compared with 75% of citizens in the general public.
Asian-American citizens were a bit less likely than the general public to turn out for the 2008 presidential election, however. Among Asian-American citizens, two-thirds (66%) report having voted in the 2008 presidential election. Seven-in-ten (70%) of the general public said in other Pew Research surveys that they voted in the 2008 election.81
There is modest variation in voting participation across U.S. Asian groups. About three-quarters or more Japanese-American citizens, a majority of whom are native born, are registered and report having voted in 2008. Among Vietnamese-Americans citizens, nearly two-thirds are registered and report voting in 2008.
Among U.S. citizens, native-born and foreign-born Asian Americans are about equally likely to be registered and to have voted in 2008.
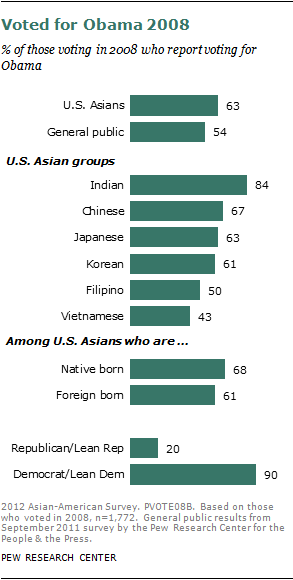
In keeping with the Democratic leanings of Asian Americans, those voting in the 2008 election were more likely to have picked the Democratic Party candidate. In 2008, 63% of Asian Americans voted for Obama, 26% for Republican John McCain.82 In the general public, 54% report voting for Obama, 35% for McCain.83
Obama’s support was strongest among Indian Americans; 84% of Indian-American voters chose Obama, to just 6% who say they voted for McCain. A majority of voters of Chinese, Japanese and Korean heritage voted for Obama over McCain in 2008. Filipino-American voters were more closely split: 50% for Obama, 39% for McCain. McCain fared better among Vietnamese Americans; 48% voted for him to 43% for Obama.
Views on Social Issues
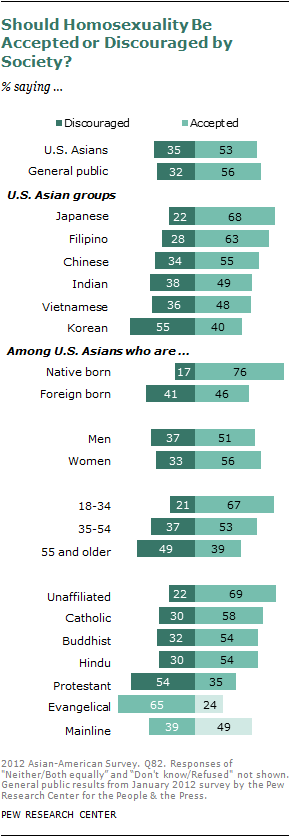
Asian Americans’ views about homosexuality are similar to the views of the general public. Overall, 53% of Asian Americans say homosexuality should be accepted by society, and 35% say it should be discouraged.
U.S.-born Asians are much more accepting of homosexuality than are Asian immigrants. Among the native born, 76% say homosexuality should be accepted. This compares with 46% of the foreign-born Asian Americans.
As is the case with the general public, young Asian Americans are more accepting of homosexuality than are older generations. Among Asian Americans ages 18 to 34, fully two-thirds (67%) say homosexuality should be accepted. Those ages 35 to 54 are less accepting (53% say homosexuality should be accepted). Among those ages 55 and older, 39% say homosexuality should be accepted, while half (49%) say it should be discouraged.
Views differ somewhat across U.S. Asian groups. Japanese Americans and Filipino Americans are the most accepting of homosexuality—more than six-in-ten of each group say homosexuality should be accepted. Korean Americans are the least accepting—40% say homosexuality should be accepted, while 55% say it should be discouraged. Chinese Americans fall in the middle. As with Asian Americans as a whole, however, Chinese Americans born in the U.S. are more accepting of homosexuality than are Chinese immigrants (85% of native-born and 46% of foreign-born Chinese Americans say homosexuality should be accepted by society).
Acceptance of homosexuality is also closely tied to religious affiliation. Asian Americans who are not affiliated with a religion are among the most accepting. Fully 69% of unaffiliated Asian Americans say homosexuality should be accepted. At the opposite end of the spectrum are evangelical Protestants, only 24% of whom say homosexuality should be accepted. A solid majority of evangelicals (65%) say homosexuality should be discouraged. Among Asian Americans who are Buddhist or Hindu, narrow majorities say homosexuality should be accepted. Among Catholics, the balance of opinion is more toward acceptance: 58% say homosexuality should be accepted, and 30% say it should be discouraged.
Views on Abortion
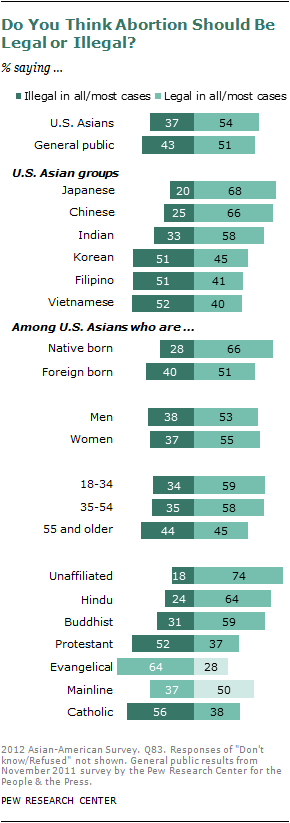
Survey respondents were also asked about their views on abortion. About half (54%) of Asian Americans say abortion should be legal in all or most circumstances, and 37% say it should be illegal. U.S. Asians’ views on abortion are similar to those of the general public. Among all adults in the U.S., 51% say abortion should be legal in all or most cases, and 43% say it should be illegal.
Younger Asian Americans are more likely than older Asian Americans to say abortion should be legal. And U.S.-born Asians are more likely than immigrant Asians to say abortion should be legal. Men and women hold similar views on abortion.
As is the case with views on homosexuality, opinion about abortion is closely linked to religious affiliation. Evangelical Protestant and Catholic Asian Americans are especially likely to say abortion should be illegal. (The same pattern is found among white evangelical Protestants in the general public.) A strong majority of Asian Americans who are Buddhist or Hindu or who have no religious affiliation say abortion should be legal in all or most circumstances.


