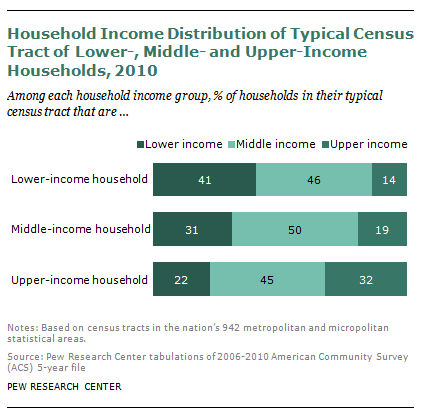
In 2010, the average lower-income household resided in a tract composed of 41% lower-income households and 14% upper-income households. In contrast, the typical upper-income household resided in a tract composed of 22% lower-income households and 32% upper-income households. The typical middle income household resided in a census tract that had 31% lower-income households and 19% upper-income households.
Since 1980, lower-income households have become increasingly likely to live in tracts with more lower-income households. In 2010, the average lower-income household resided in a tract with 41% lower-income households, an increase from 39% in 1980.
Likewise, since 1980 upper-income households have become increasingly likely to live in a tract with other upper-income households. In 2010, the average upper-income household resided in a tract composed of 32% upper-income households, an increase from 25% in 1980.
However, the Pew Research Center analysis of the composition of census tracts by income class is not entirely consistent with what some observers5 have dubbed a “secession of the successful” to describe the changing configuration of neighborhoods in recent decades. Though the typical upper-income household is more likely to live alongside other upper-income households, more than two-thirds of the neighbors of the typical upper-income household in 2010 were either middle income or lower-income households.
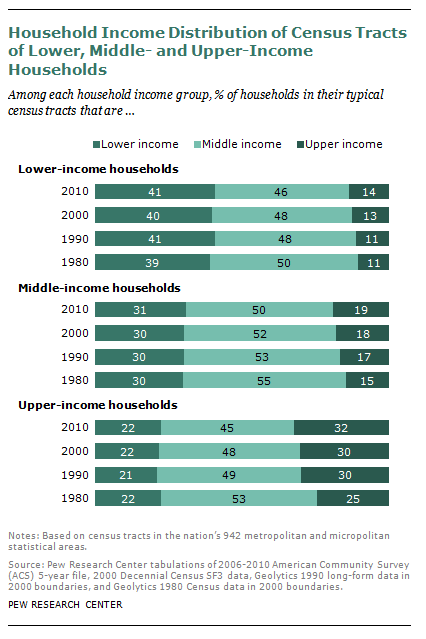
Moreover, rather than distancing themselves from the poor, upper-income households have the same degree of exposure to lower-income households as in 1980. In 2010, the typical census tract of upper-income households was composed of 22% lower-income households, unchanged from the 1980 level.
Finally, upper-income households are not the only group that is increasingly exposed to other upper-income households. Lower and middle-income households are also increasingly likely to live in a census tract with more upper-income households. For example, in 2010 the typical lower-income household was located in a tract having 14% upper-income households, an increase from 11% in 1980. Upper-income households have grown at a faster rate than other income groups over the past several decades, and thus all groups are more likely to be exposed to them.


